Thematic Map: Difference between revisions
| Line 26: | Line 26: | ||
#Define if the attribute values are ''absolute'' or ''relative'' and if they shall be ''classified'' and choose the ''representation feature'' to visualize the theme. | #Define if the attribute values are ''absolute'' or ''relative'' and if they shall be ''classified'' and choose the ''representation feature'' to visualize the theme. | ||
#:[[File:hint.jpg|hint]]The ''Classify'' and the ''representation feature'' option are disabled if more than one attribute is chosen. | #:[[File:hint.jpg|hint]]The ''Classify'' and the ''representation feature'' option are disabled if more than one attribute is chosen. | ||
#Click the '''Next''' button to go on with Step 2. | |||
[[File:ThematicMapStep1.png]] | [[File:ThematicMapStep1.png]] | ||
Revision as of 13:09, 6 June 2016
OCAD ThematicMapper has been developped in a joint project of the OCAD Inc. and the Institute of Cartography and Geoinformation at ETH Zurich. As a core of the new application a step-by-step wizard guides - considering established cartographic rules - through the process of creating thematic maps. The wizard supports the user from the data analysis to the thematic symbolization and visualization. The OCAD ThematicMapper opens the OCAD software for the broad scope of thematic statistical maps.
Create a Thematic Map 


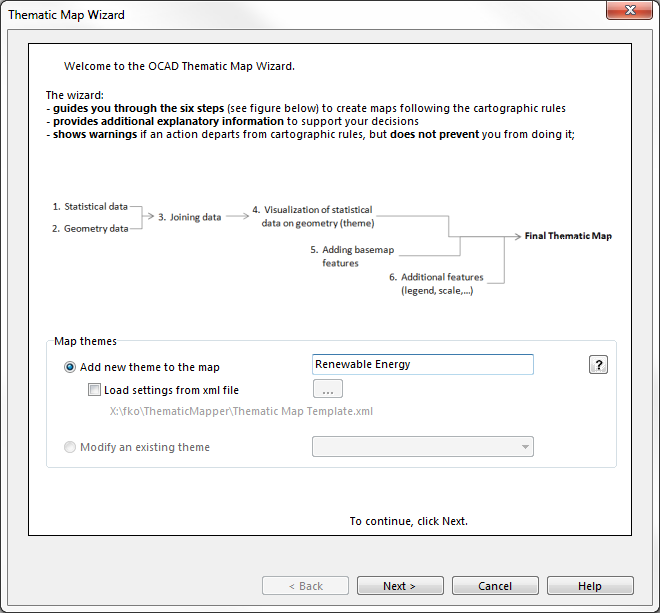
You can get access to the Thematic Map Wizard by opening a New File with choosing Thematic Map as a map type (this is done silently in the OCAD ThematicMapper edition) or by clicking Create with Wizard... in the Thematic Map menu. It opens the Welcome page of the wizard with an overview of the six steps to create a thematic map.
Requirements
OCAD ThematicMapper module requires the Borland Database Engine and the Microsoft Access Database Engine. See also system requirements.
Welcome Page
Add a new theme
Choose the Add new theme to the map option and enter a name for the theme (ex. population change). It is possible to load the wizard settings with the load settings from xml file option if you have already created thematic maps with the Thematic Map Wizard. The xml file can be choosen with the ... button.
![]() A map can have more than one theme (ex. choropleths + proportional symbols).
A map can have more than one theme (ex. choropleths + proportional symbols).
![]() The next button is only active if a theme name is set.
The next button is only active if a theme name is set.
Modify an existing theme
Use the option Modify an existing theme to change the settings of an already existing theme in your map file.

Step 1 - Statistical Data
- Load statistical data from a file (*.xls, *.csv, *.dbf or *.txt).
- Select attributes to visualize either by double click, drag and drop or selecting them and pressing the [>]-button.
- Define if the attribute values are absolute or relative and if they shall be classified and choose the representation feature to visualize the theme.
- Click the Next button to go on with Step 2.
Step 2 - Geometry
- Load a geometry data from .shp file.
- Set map scale and map size.
- Pick a coordinat system.
Step 3 - Join Data
- Pick a common field of both tables.
- Decide if all records shall be kept or only the matching ones.
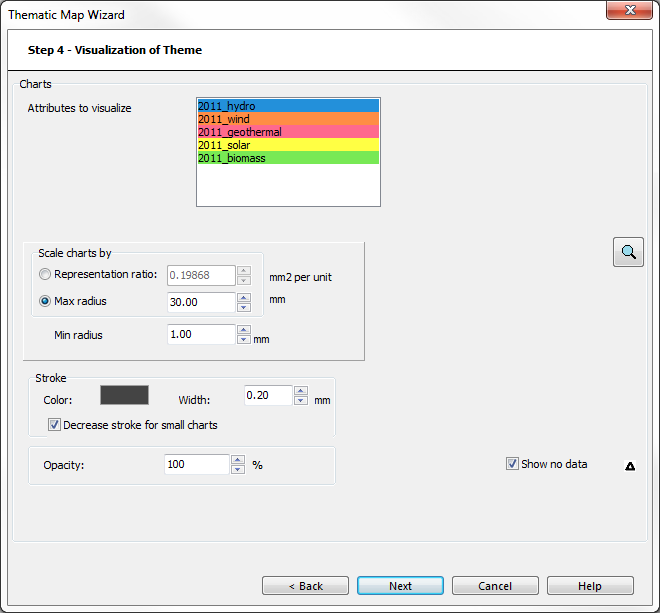
Step 4 - Visualization of map's theme
Phase 1
Decide which visualization method is suitable for the chosen data. The wizard suggests the most appropriate method(s) according to the choices done in Step 1.
Phase 1.5: Only for divided charts
- Divide the attributes to several groupes by clicking on the [...]-button and opening the Create Groups with Drag and Drop window.
- Define the proportionality of the chart elements.
- Define the amount emphasis.
- Make your choice out of the available charts.
Phase 2
- Decide which visualization type shall be used.
- A double click on the attribute(s) opens the color picker and allows to change the coloration either with CMYK or RGB.
- Define the scale, minimum height and bar width for the visualization.
- Define the stroke setting.
- Click in the color box to open the color picker and select a color.
- Define the stroke width and decide if the stroke shall decrease for small symbols.
- Decide if 0 values and no data shall be shown.
- Define the opacity.
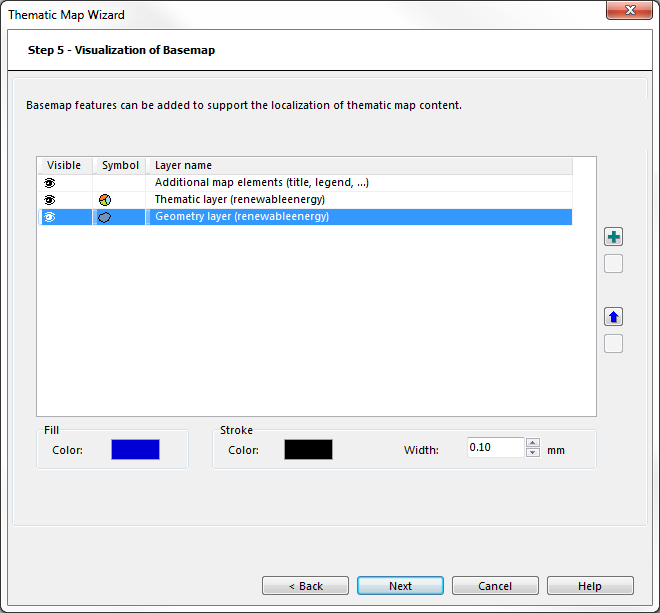
Step 5 - Visualization of Basemap
This step shows the different layers and can be edited and arranged. Additional layers can be added and removed
.
![]() Make sure that the basemap features are suitable for this scale.
Make sure that the basemap features are suitable for this scale.
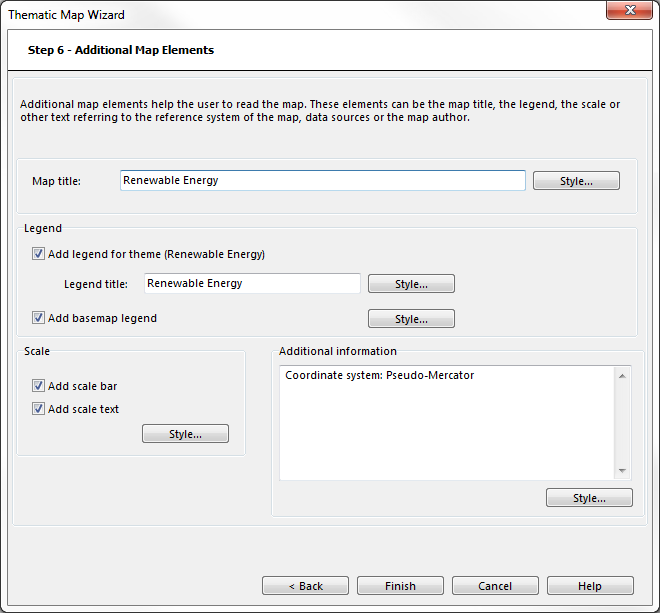
Step 6 - Additional Map Elements
Additional map elements help the user to read the map.
- Set a map title.
- Decide if any legends shall be added.
- Decide if a scale bar or a scale text shall be added.
- Decide if you want to add any additional text information.
![]() Any text element can get it's own style setting.
Any text element can get it's own style setting.
Create Thematic Maps with XML Script
OCAD XML scripts functionality does also support to create thematic maps with xml script
Thematic Map Samples
There are several sample maps available in the OCAD program subfolder Samples\ThematicMapper (usually C:\Program Files\OCAD\OCAD 12\Samples\ThematicMapper) as well as statistic data samples, geometry data samples and XML script samples.
![]() Open the sample maps by using Open Sample Map... in the File menu.
Open the sample maps by using Open Sample Map... in the File menu.
![]() Execute the XML scripts by using Execute XML Script in the File menu.
Execute the XML scripts by using Execute XML Script in the File menu.
Thematic Map Videos
![]() [Create an Energy Production Wing Charts Map]
[Create an Energy Production Wing Charts Map]
![]() [Create a Population Change Choropleth Map]
[Create a Population Change Choropleth Map]
Back to Main Page
Previous Chapter: Database
Next Chapter: XML Script


