Drawing Orienteering Maps in OCAD: Difference between revisions
(→Colors) |
|||
| Line 261: | Line 261: | ||
The actual ISOM Symbol Sets of OCAD contains the latest CMYK color value. However, they may change from time to time. The latest CMYK color values can be found [[https://orienteering.org/resources/mapping/ here]]. | The actual ISOM Symbol Sets of OCAD contains the latest CMYK color value. However, they may change from time to time. The latest CMYK color values can be found [[https://orienteering.org/resources/mapping/ here]]. | ||
===Symbol Sets for Orienteering Maps=== | |||
OCAD provides many predefined symbol sets for orientation maps and continuously adapts them to the currently valid specifications. | |||
OCAD | Select one of the symbol sets when starting a new file. | ||
See the page '''[[Symbol_Set_Overview|Symbol Set Overview]]''' to get an overview of the current and old symbol sets that are used in orienteering sports. | |||
If your map is still in an older standard, you can change the symbols with the '''[[Symbol_Set_Conversion|Symbol Set Conversion]]''' function. | |||
==Print and Export== | ==Print and Export== | ||
Revision as of 16:00, 4 April 2023
The focus of this tutorial is how to draw an orienteering map with OCAD.
If you update an old existing map, please see the page Updating Orienteering Maps in OCAD.
About OCAD
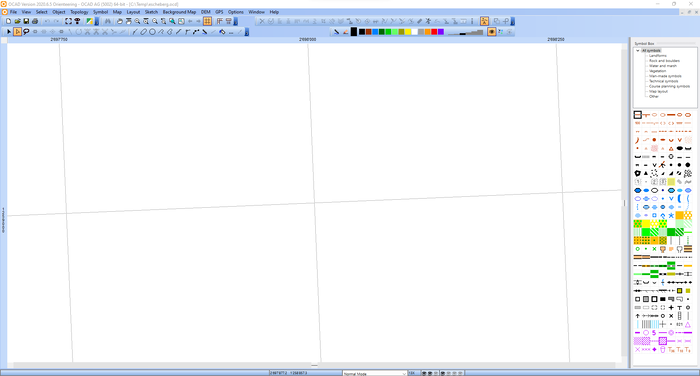
Structure of the OCAD User Interface
The image below shows you the OCAD User Interface.

OCAD Help
OCAD provides numerous help material. You will find a detailed list in the Help menu.
Service Update
Regular and free updates are included in the OCAD subscription model. The Service Update corrects known bugs and adds the latest cartography tools and enhancements to your OCAD.
Therefore we recommend using OCAD software always with the most recent Service Update to benefit from the quality improvements.
Please download the current Service Update from the Help -> OCAD Update function in the OCAD program.
The content of the Service Update is listed in the Release notes. Your current version of OCAD can be seen under About OCAD in the Help menu.
New Map
Start a new map using the New Map Wizard. The New Map Wizard is especially helpful if like to georeference your map and import directly cadastral data. Alternatives, you can also start a new file.
Start the New Map Wizard.
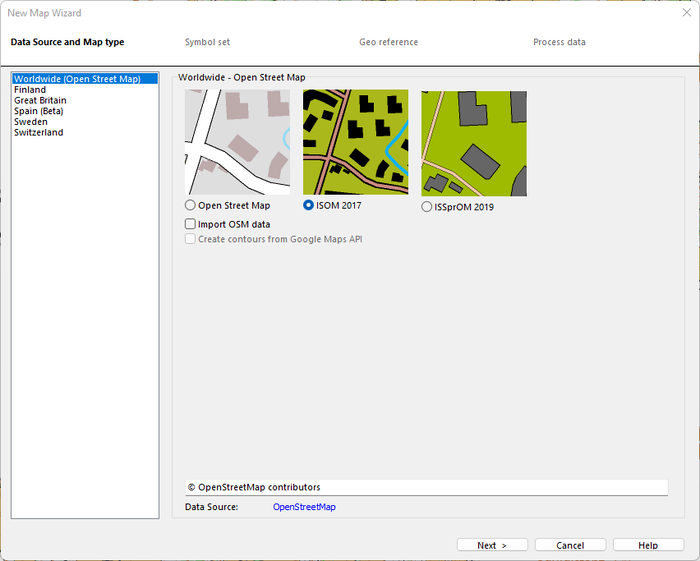
- Data Source and Map type
In the first step of the wizard, you can import available geodata directly into OCAD.
If other available geodata are displayed in your country (on the left in the dialogue), it is worth importing them.
You can also import Open Street Map (OSM) data, which are available worldwide.
You can also use the wizard without importing geodata and only georeferencing the map correctly.
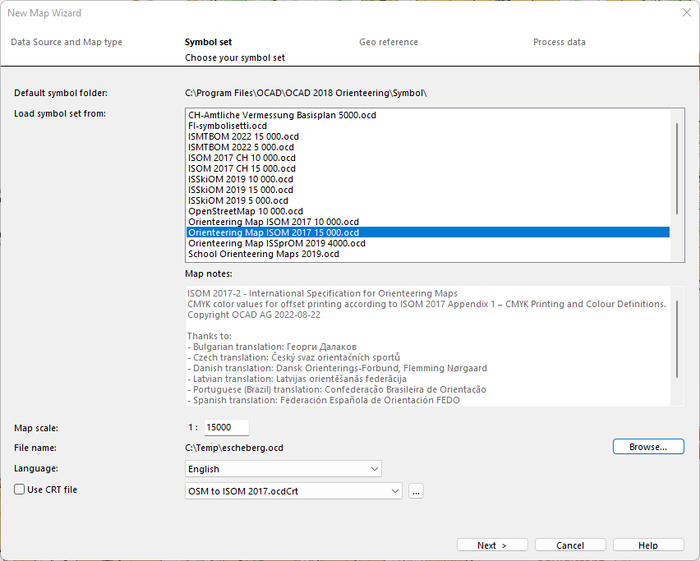
- Symbol set
Select a symbol set, e.g., Orienteering Map ISOM 2017 15000.ocd
Choose a map scale, e.g., 1: 15'000.
Assign a file name.
If you have imported geodata in the first sep, use a CRT file to ensure that the imported objects are assigned to the correct OCAD symbols.
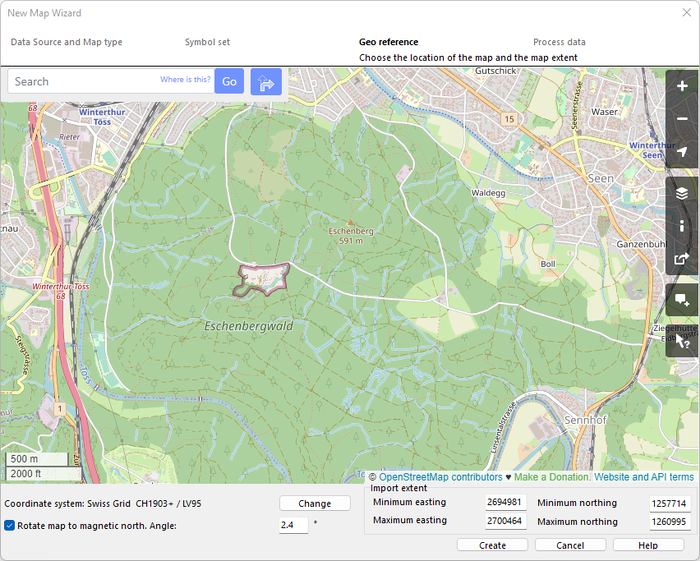
- Georeference
Move and zoom on the map to the desired map section.
The data listed above is downloaded for the map section you see in the window. If you move the map in the window, the import area in the lower right area is adjusted. Keep the map section as small as possible so that an unnecessarily large amount of data is not downloaded.
In the lower right area of the dialogue, you can adjust the import area yourself by entering coordinates. This can be useful if, for example, the map extends north-south and you do not want to download an unnecessary amount of data on the east and west edges.
Select the coordinate system.
Select Rotate map to magnetic north. Leave the suggested angle.
Create the map.
- Result
the wizard now creates a new file, which is correctly georeferenced and contains the desired symbol set.
Create the Base Map for the Field Work
Before you go mapping into the terrain, you should try to create the best possible base map. The more you invest in your base map, the faster and more accurate your mapping will be. In OCAD you can import spatial data, load old orienteering maps, derive own base maps with LiDAR data, connect to WMS/WMTS and combine them. You can also sketch features based on hill shadings, orthophotos, ect. before you go to the terrain.
Raster Base Maps
Typically, the orthophotos and topographic maps for orienteering maps are delivered as raster files. OCAD supports, among others, the most common used raster files: JPG, TIFF and PNG.
Orthophotos and topographic maps are mostly georeferenced. Raster files are georeferenced, when the pixels are referenced with the coordinates. Normally the georeferencing data is saved in a world file in the same folder. The world file has the same file name as the raster file, but with another file extension: Picture1.JPG → Picture1.JGW, Picture2.TIFF → Picture2.TFW, Picture3.PNG → Picture3.PGW.
Open Georeferenced Raster Base Map as Background Map
Click to Background Map->Open
If there's not yet a coordinate system and offset, the Background Map (Georeferenced) dialog appears and shows the proposed georeferencing of the selected background map.
Click OK.
The georeferencing raster files will be automatically displayed at the right position.
Open not Georeferenced Raster Base Map as a Background Map
Click to Background Map->Open
It the seleced file is not georeferenced (e.g. an old orienteering map), you need to enter a resolution for the background map (e.g. 300 dpi) and click the OK button.
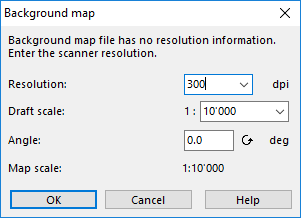
The background map is displayed at the center of the current drawing area. The raster map (background map) now needs to be adjusted with the map (Adjust a Background Map). In other words, it needs to be referenced with the map coordinate system.
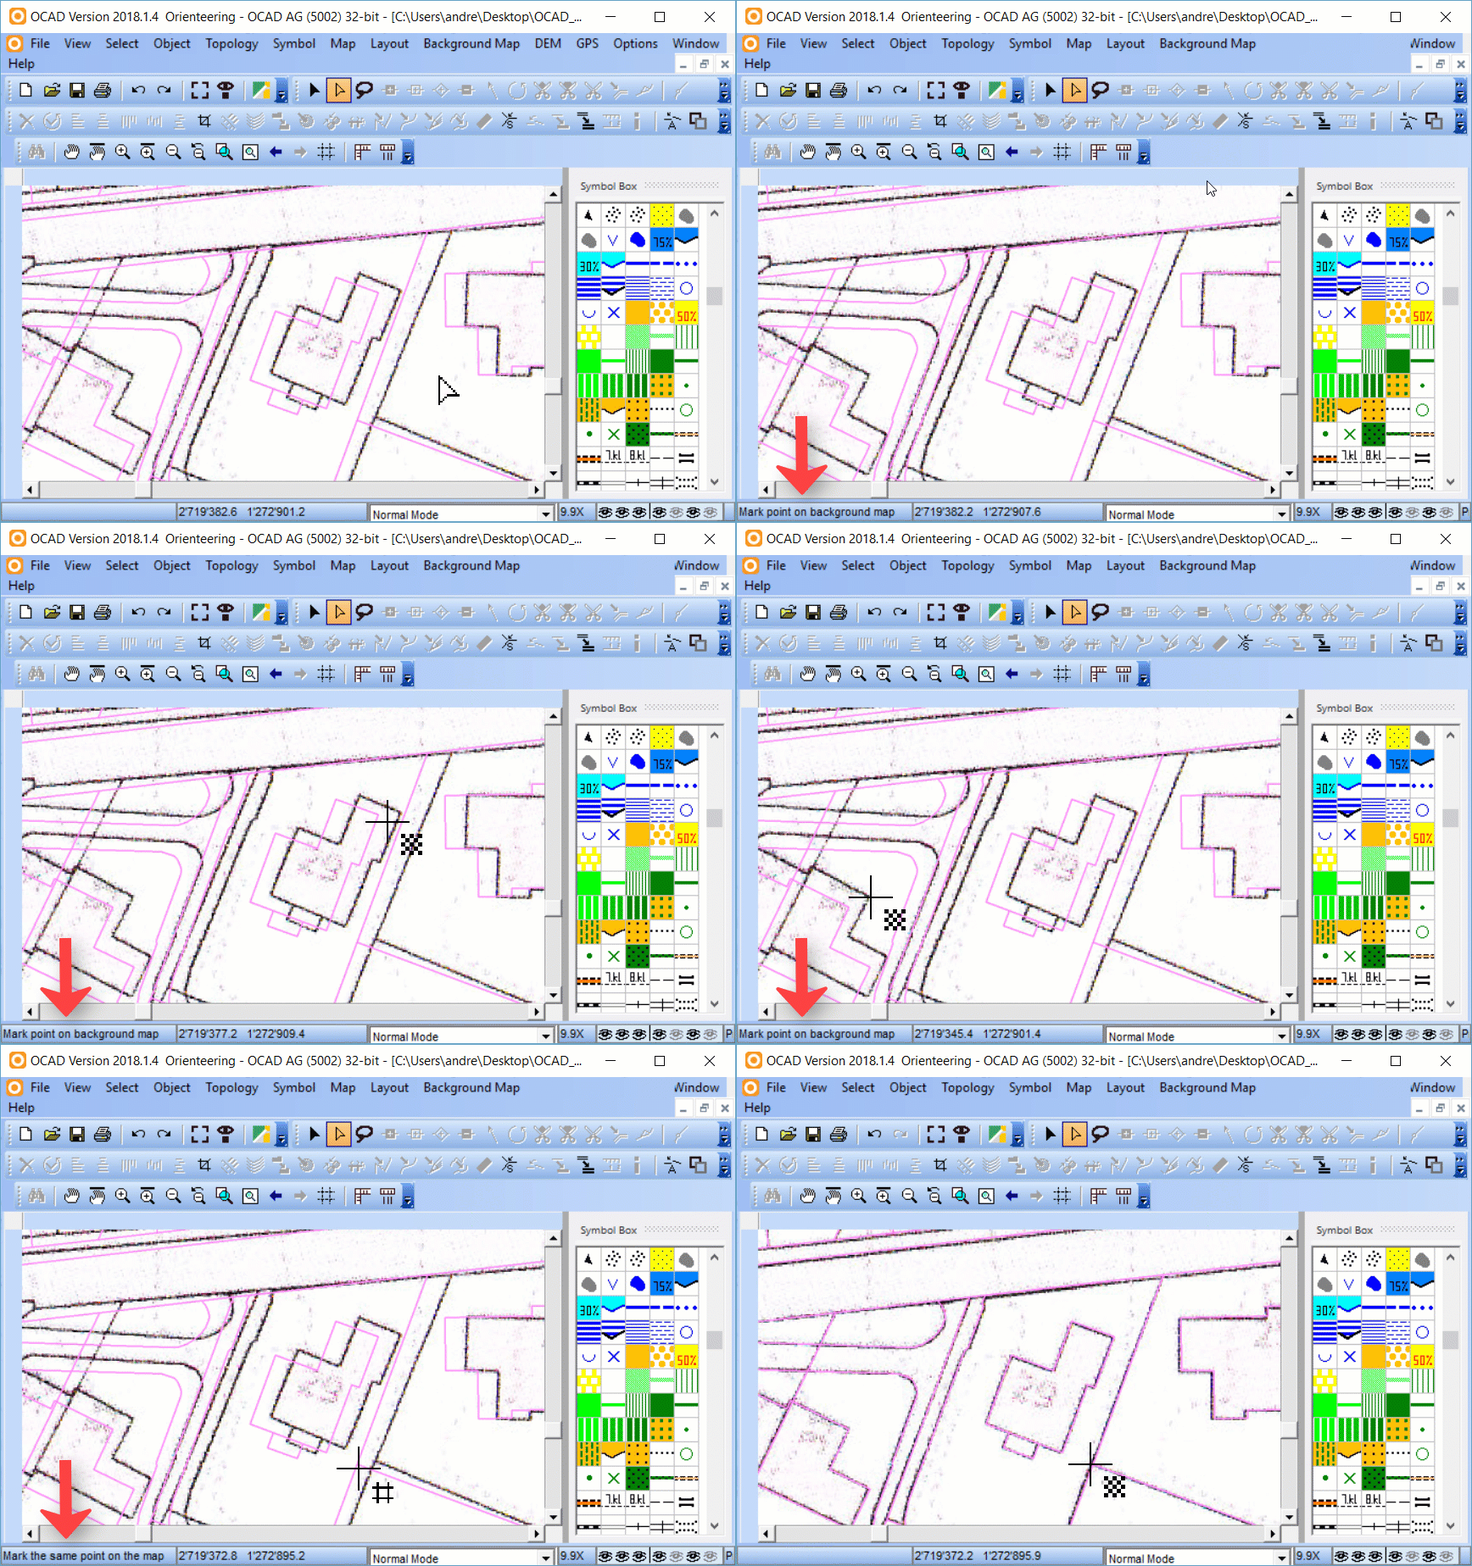
![]() We recommend you to print the grid on the base map. Thereby you can adjust your scanned base map easier.
In the dialog File->Print select Print screen grid and choose the Grid color.
We recommend you to print the grid on the base map. Thereby you can adjust your scanned base map easier.
In the dialog File->Print select Print screen grid and choose the Grid color.
Preparation of LiDAR Data
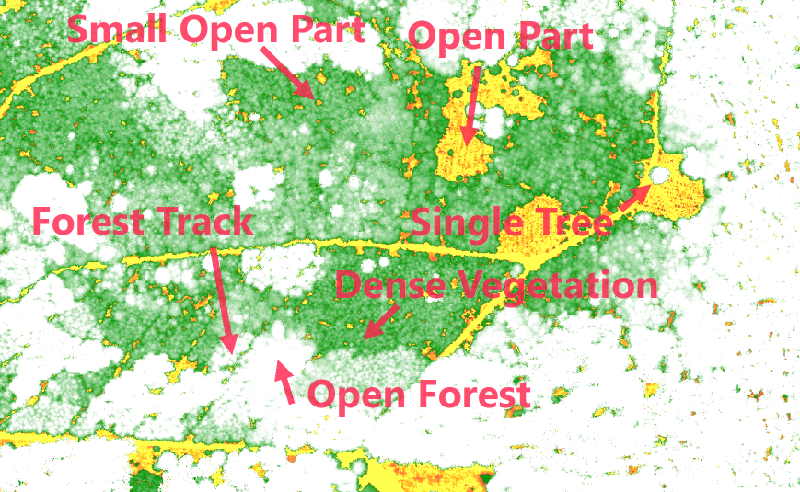
LiDAR data is often a base for orienteering maps and highly recommended to use if available. LiDAR data is available as a point cloud in the las/laz file format. With LiDAR data, you can easily get lot of information about the terrain and the vegetation, which will make mapping much faster and more accurate.
For this purpose, there's an extra tutorial about Using Airborne Laserscanning Data for Orienteering Base Map Generation. There you will learn, how to proceed LiDAR data in OCAD and how to use them when drawing orienteering maps..
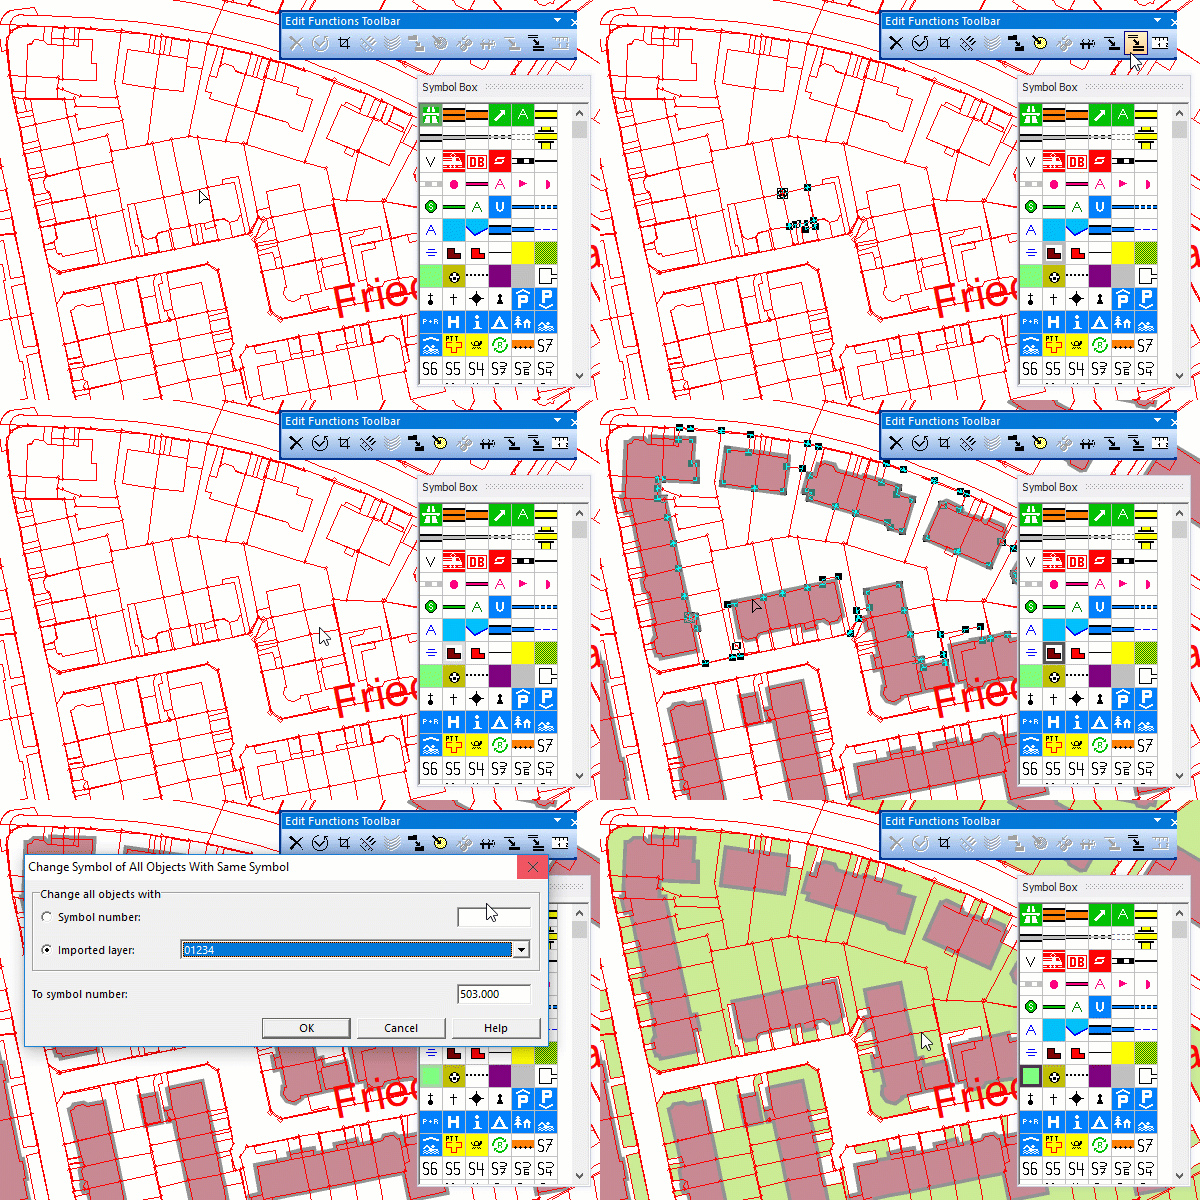
Import Vector Data
Vector data can also be used to create the base map. The advantage is that vector data contain point, line, area and text objects which are directly converted to map objects during the import into OCAD. It saves a lot of time because especially in urban surroundings many map objects can be created automatically instead of being digitized manually. Governmental data is generally available as Shape files, GeoPackages or DXF. OCAD can also import other vector data formats like PDF, AI, SVG or OSM (Open Street Map).
- Go to File->Import
- Choose an importable file, e.g. a dxf-file.
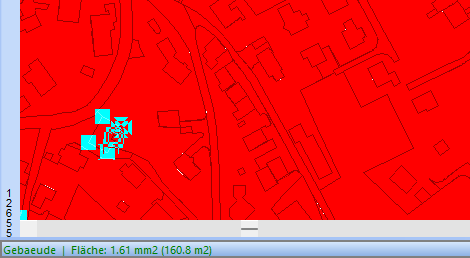
- The vector data is shown as Unsymbolized objects in the drawing area. If you select an object, the layer designation is displayed in the bottom left of the status bar.
- You can symbolize the objects automatically:
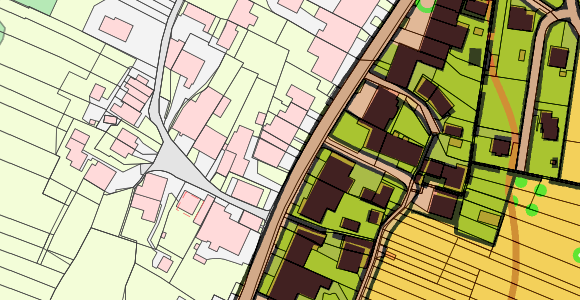
- The map now shows all objects with the assigned symbols.
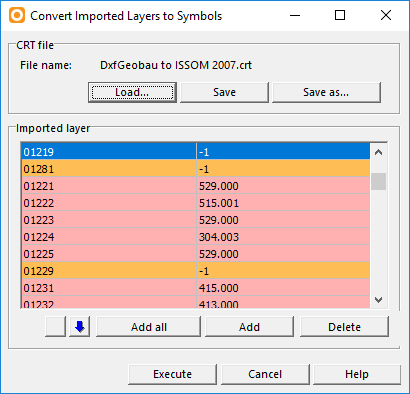
![]() You can also Convert the imported Layers manually.
You can also Convert the imported Layers manually.
Add more data sources
Connect to WMS/WMTS
You can connect to a WMS (Web Map Service) or WMTS (Web Map Tile Service) and use their images as background maps in OCAD.
There are already many predefined connections in OCAD, which you can use.
Load a georeferenced aerial image
In the Online Map Services menu, you can load a georeferenced aerial image e.g., from Google Maps into the map.
Start Geoviewer
Select the Open Geoviewer icon in the toolbar.
Click in the drawing area and Google Street Map will open in the appropriate place.
Display of the base map in OCAD
After completing the wizard and/or importing (further) geodata, the results can be viewed in OCAD.
If you use a mobile device for field mapping, then you can switch between the different base maps.
In OCAD, all raster maps are listed in the menu Background Map -> Manage. You can change the visibility (V) and the order of the background maps there.
The background map at the top of the list is displayed in the OCAD window before the other background maps.
The transparency (T) of the background map can also be set here. For example, an aerial photograph can be combined with a vegetation height map. The transparency cannot be set later in the OCAD Sketch app.
Switch to Draft Mode in the View menu. This makes the drawing area transparent, and the background maps are visible under the map. A slider appears in the view toolbar to adjust the opacity of the Map/Map (M) and the Background Map/Background Map (B).
Dark area signatures in the base map can be disturbing for the terrain mapping, as the sketches do not appear well legible on them. The following functions help you to tackle this problem.
- Hide (F4) irrelevant symbols for the terrain survey.
- Convert area symbols to line symbols.
- Hatch Areas so that they become transparent.
Mapping in the terrain
Nowadays, with the right background material and equipment, mapping in the terrain is not about the right place of the object - it is about which objects should be on the map. This process is called generalisation and is done differently by every cartographer. Also, it is more important to draw the object right relative to the others than exactly true-to-location.
Mobile Mapping
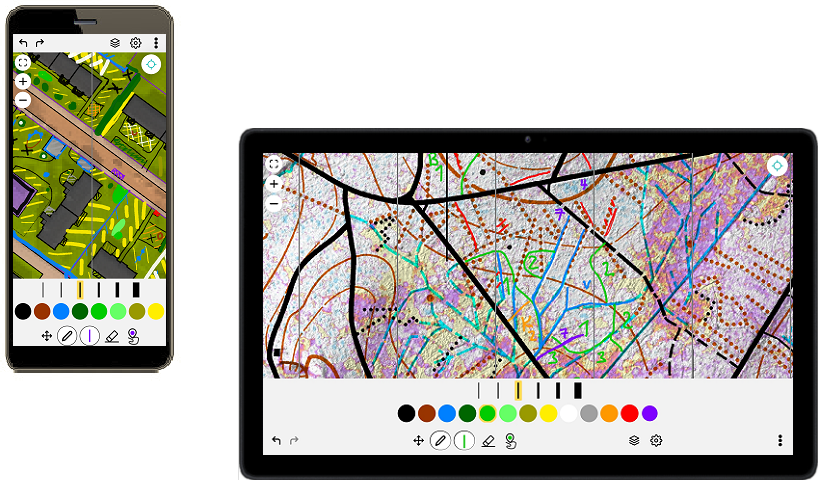
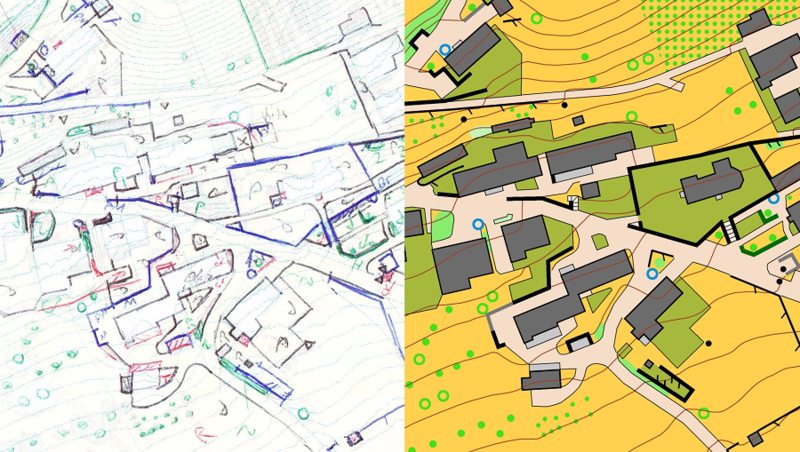
Mobile mapping with the OCAD Sketch App has several advantages over a traditional pen and paper terrain survey:
- Possibility to switch between different background maps
- Use of GPS for position determination and trajectory
- Different colours and line thickness, plus an eraser tool
- Manage multiple projects on one device
- Promote collaboration thanks to OCAD Cloud Transfer (event adviser, controller, course setter with map maker)
- No more scanning and matching of the paper sketch necessary, as sketches from app are georeferenced
![]() If you are interested in buying a tablet, you can find some recommendations here.
If you are interested in buying a tablet, you can find some recommendations here.
OCAD on Android or iOS devices
The OCAD Sketch App complements the desktop version of OCAD and runs on Android and iOS devices. It is designed for mapping in the field – both for new mapping as well as revisions, feedback from course planners or map reviewers. The OCAD Sketch App can be downloaded for free from Google Play Store (Android) or Apple App Store (iOS). Search for OCAD Sketch.
+ Very ergonomic and intuitive to use. Designed specifically for mobile mapping.
- Only sketches can be drawn and not OCAD objects directly.
All information about the OCAD is available at https://www.ocad.com/app
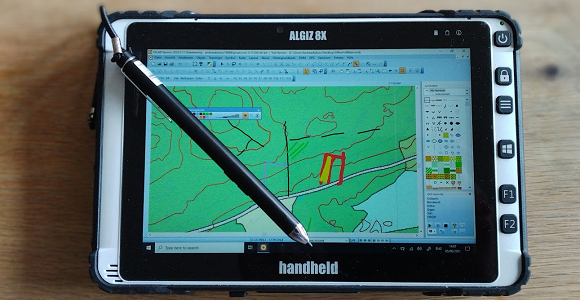
OCAD on Windows Tablet
OCAD has been developped as a Desktop application. However, OCAD also runs on Windows tablets.
+ You have the full OCAD functionality and can draw the map directly in the terrain, instead of just draw sketches.
- Operation is not as ergonomic as in OCAD Sketch App, which has been designed for mobile devices.
Paper and Pen
The old fashioned way to map in the terrain.
+ You don't have to worry about the battery running out or the tablet breaking down.
- You have no GPS support and cannot switch between differnt background maps. Also, you need to scan the field work, open it as a background map and adjust it later in OCAD.
Draw an Object on the Map
To draw an object, click on the symbol in the symbol box first, then choose the drawing tool in the toolbar and finally draw the object in the drawing area.
Please read the Wiki Page Drawing an Object to learn more about it.
Edit Objects
To edit an object, there are many edit tools:
- Edit tools in the Edit and Drawing Toolbar
- Edit functions in the Edit Functions Toolbar
To edit an object, the object has to been selected:
Find more information on the Edit Object page.
Draw map legibly
The term generalisation deals with the question of which objects are important and should appear on a map and which should not. The problem on orienteering maps is rarely that there are too few objects on the map. Rather, the map is overloaded with too many and too small objects. One reason for this is the accurate background maps nowadays, on which every detail can be seen.
Be also aware, that orienteering maps are no cadastral maps. Readability is much more important than position accuracy. You are allowed to cheat, e.g. make buildings smaller to emphasize a passage.
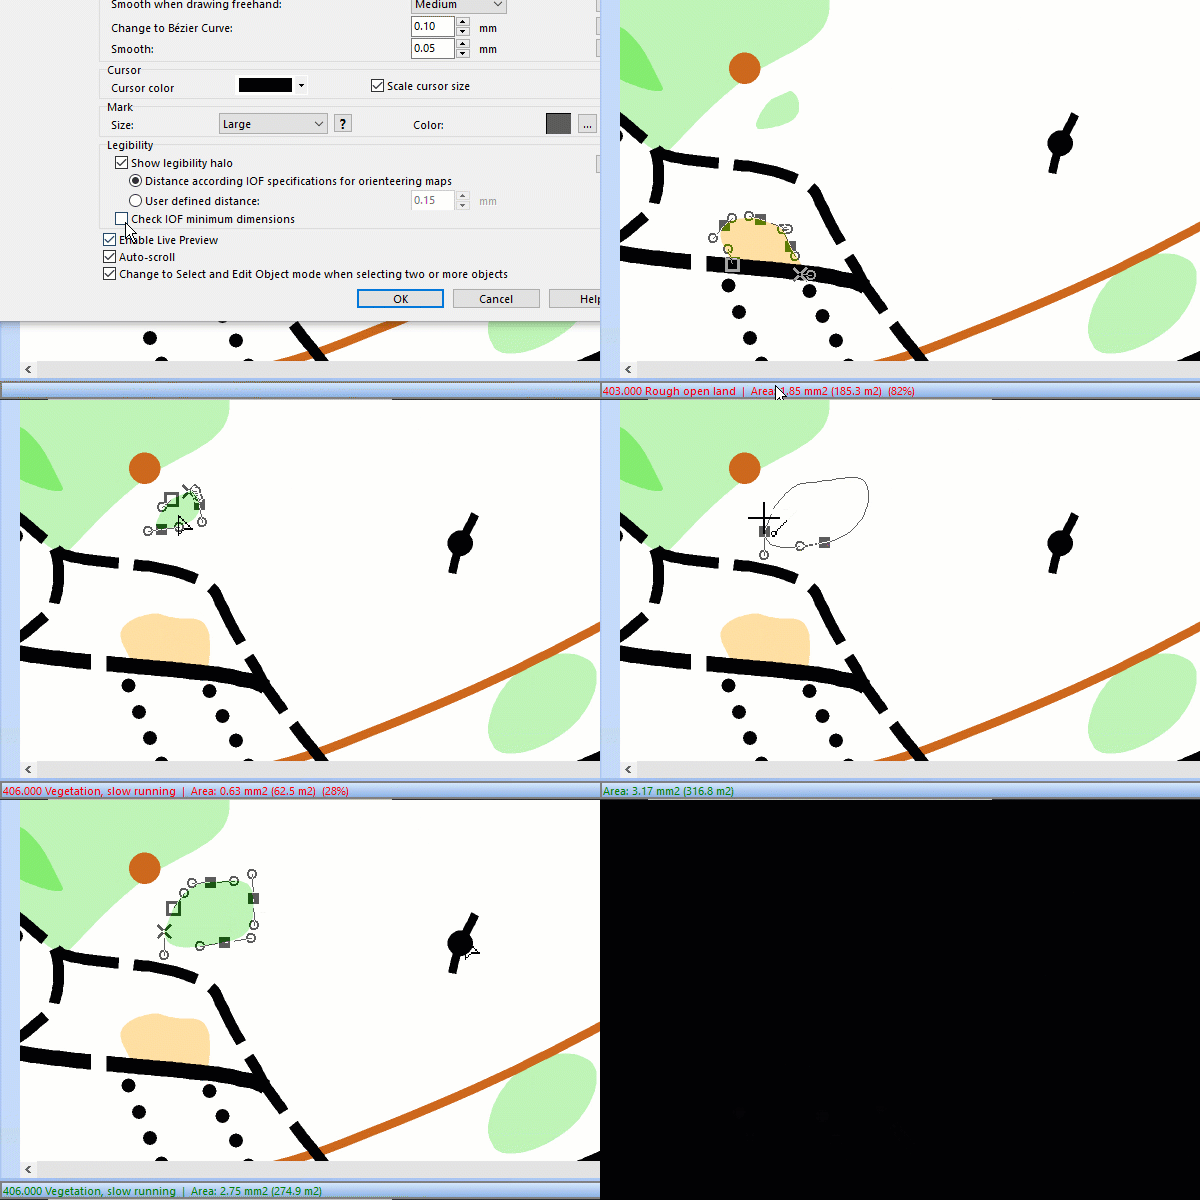
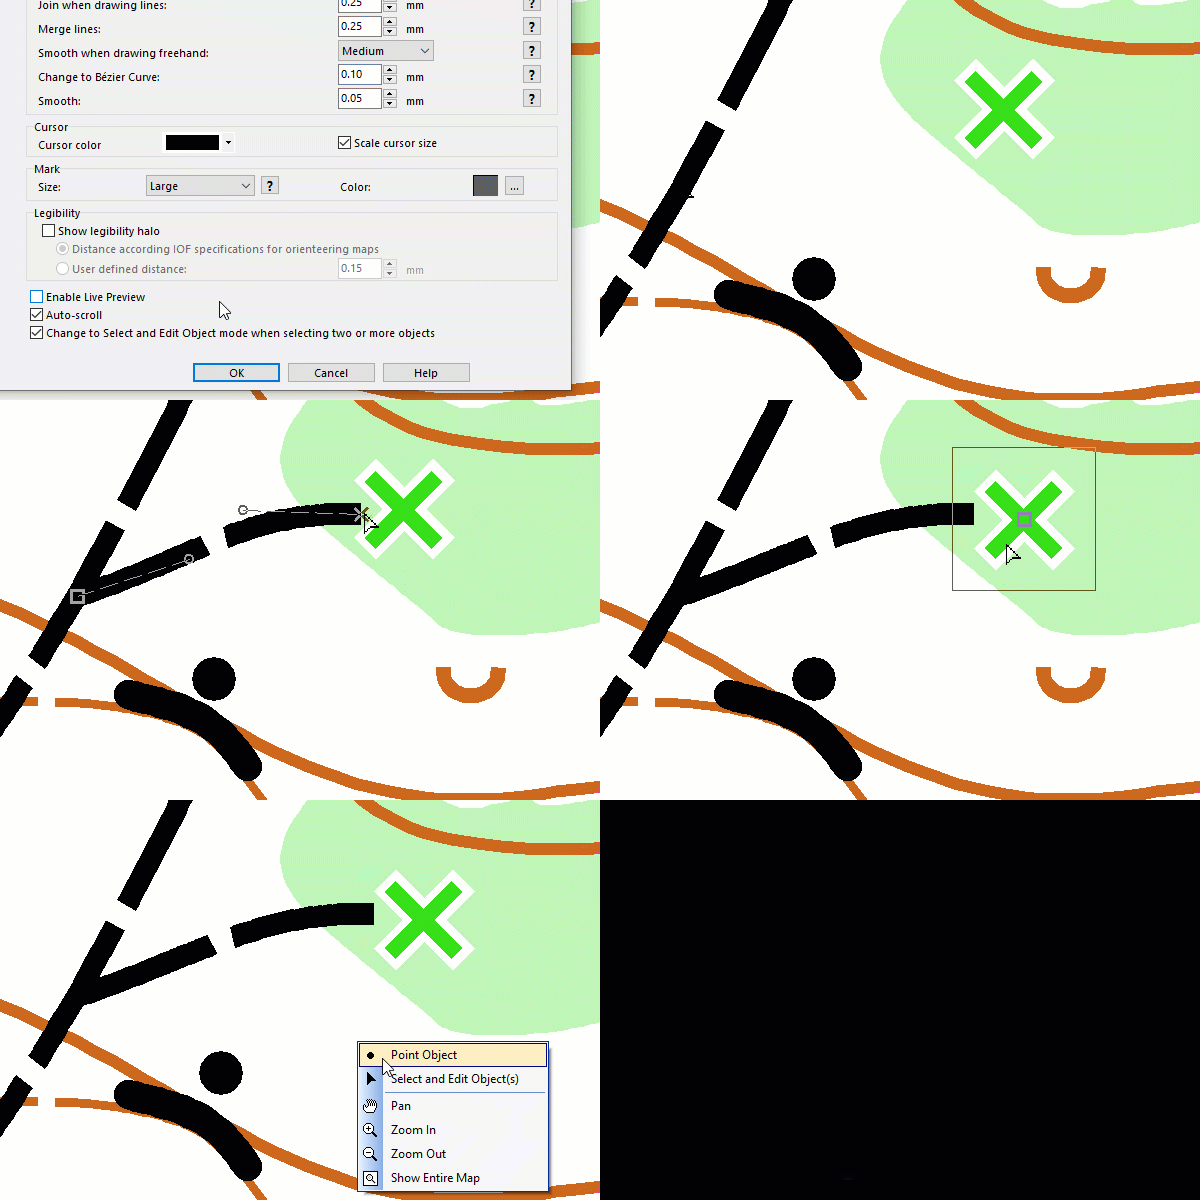
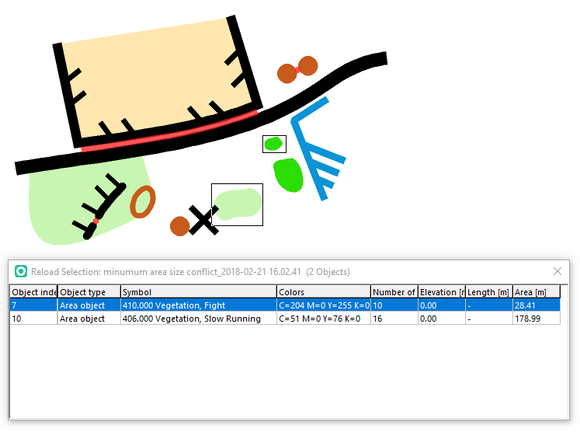
The International Orienteering Federation (IOF) has developed specifications that define a minimum size for each symbol. In OCAD it is possible to check directly during drawing whether the drawn line or surface object corresponds to the minimum size of the specifications.
The following tools and functions helpyou to draw the map legibly:
Colors and Symbols
Colors
In the Colors dialog you can manage the colors of the symbols. You shouldn’t change something in the list, when you don’t know what you are doing. The order of the colors in the color list regulates the overlaying: a color covers at the printing all the colors that are below.
The actual ISOM Symbol Sets of OCAD contains the latest CMYK color value. However, they may change from time to time. The latest CMYK color values can be found [here].
Symbol Sets for Orienteering Maps
OCAD provides many predefined symbol sets for orientation maps and continuously adapts them to the currently valid specifications. Select one of the symbol sets when starting a new file.
See the page Symbol Set Overview to get an overview of the current and old symbol sets that are used in orienteering sports.
If your map is still in an older standard, you can change the symbols with the Symbol Set Conversion function.
Print and Export
Go to File>Print (or Ctrl+P) to print your map. Select printer, scale and extend. Read more on the Printing Maps page.
![]() Print your map in the intended scale after a while. Check if you can read all details. Remember to keep at least the minimum dimensions defined by the IOF. The Check Legibility function helps you with that. When working with 64x zoom level, you easily get too small and too many symbols on your map.
Print your map in the intended scale after a while. Check if you can read all details. Remember to keep at least the minimum dimensions defined by the IOF. The Check Legibility function helps you with that. When working with 64x zoom level, you easily get too small and too many symbols on your map.
Export Files
Go to File>Export (or Ctrl+E) to export your map. Set output file, quality and extend. Read more on the Export Files page.
![]() You can't export a PDF, when you are in the Draft View mode. Change to the Normal mode.
You can't export a PDF, when you are in the Draft View mode. Change to the Normal mode.
![]() Due to color display, we recommend you to always create a PDF first out of OCAD and print this PDF afterwards. OCAD works with CMYK Colors and they will only be displayed correctly this way. What you see on your screen are RGB-Colors from the Windows Graphics Device Interface (GDI). When you print maps directly out of OCAD, OCAD converts the CMYK values first in RGB values and your printer driver back to CMYK values. This way it may come to changes in the color values.
Due to color display, we recommend you to always create a PDF first out of OCAD and print this PDF afterwards. OCAD works with CMYK Colors and they will only be displayed correctly this way. What you see on your screen are RGB-Colors from the Windows Graphics Device Interface (GDI). When you print maps directly out of OCAD, OCAD converts the CMYK values first in RGB values and your printer driver back to CMYK values. This way it may come to changes in the color values.
Tipps and Tricks
- Create a Map Grid and set e.g. to 10m to get a be better sense of distance in the terrain.
- Tips with Keyboard and Mouse to optimize your drawing and editing skills in OCAD.
- Read here how to copy objects or symbols from one map to another map or how to create a own Symbol Set.
