DEM Profile
To use this function a DEM has to be loaded.
Create a Profile 


To create a profile:
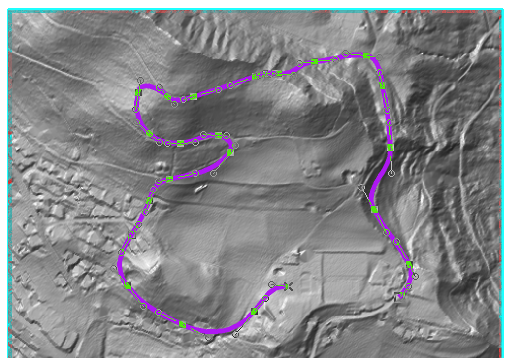
- Select a line object within the DEM data. Add a Corner Vertex to the line to create a stopover. Stopovers are visible in the profile after exporting an OCD-File or adding it to the map.
- Choose the Create Profile command from the DEM menu.
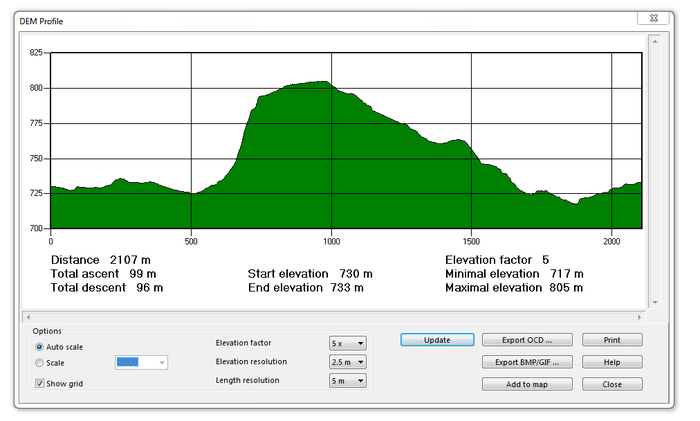
- The DEM Profile dialog appears and the profile is shown.
You have several options now:
- Auto scale: If this option is enabled, OCAD takes a scale which fits best to the dialog box.
- Scale: Choose the desired scale of the profile in the dropdown list.
- Show grid: If this box is activated, a grid is shown in the profile.
- Elevation factor: Choose an elevation factor in the dropdown list. This is the scale factor for the horizontal profile axis (height).
- The Elevation resolution and the Length resolution are filters that influence the calculation of the total ascent and total descent. These resolution values should not be more accurate than the elevation resolution and cell size of the DEM.
![]() DEM Profile dialog is a non-modal dialog. The user can switch to the OCAD map window. It is possible to edit the selected line object in the OCAD map. Click the Update button in the DEM Profile dialog to see the profile for the edited or newly selected object.
DEM Profile dialog is a non-modal dialog. The user can switch to the OCAD map window. It is possible to edit the selected line object in the OCAD map. Click the Update button in the DEM Profile dialog to see the profile for the edited or newly selected object.
Export Profile 

Export OCD
Click the Export OCD button to export the profile to a new OCD-File. The DEM Profile Options dialog appears.
The Template DEM Profile.ocd file in the OCAD-directory is chosen as a template file (for the symbol set, colors etc.) by default. You can choose an own template by clicking the Load template button.
| Symbol Number | Description | Symbol Type | Color(s) |
|---|---|---|---|
| 10000.001 | DEM: Elevation Text | Text symbol | 10000: UPPER BLACK DEM PROFILE |
| 10000.002 | DEM: Distance Text | Text symbol | 10000: UPPER BLACK DEM PROFILE |
| 10000.003 | DEM: Text | Text symbol | 10000: UPPER BLACK DEM PROFILE |
| 10000.004 | DEM: Horizontal Grid Line | Line symbol | 10006: LOWER BLACK DEM PROFILE |
| 10000.005 | DEM: Profile Frame | Line symbol | 10000: UPPER BLACK DEM PROFILE |
| 10000.006 | DEM: Profile Line | Line symbol | 10005: LOWER RED DEM PROFILE |
| 10000.007 | DEM: Profile Area | Area symbol | 10003: GREEN DEM PROFILE |
| 10000.008 | DEM: White Background | Area symbol | 10002: WHITE DEM PROFILE |
| 10000.009 | DEM: Horizontal Tag | Point symbol | 10000: UPPER BLACK DEM PROFILE |
| 10000.010 | DEM: Vertical Tag | Point symbol | 10000: UPPER BLACK DEM PROFILE |
| 10000.011 | DEM: Time Text | Text symbol | 10000: UPPER BLACK DEM PROFILE |
| 10000.012 | DEM: Label Text Stopover | Text symbol | 10000: UPPER BLACK DEM PROFILE |
| 10000.014 | DEM: Label Text Start- and Endpoint | Text symbol | 10000: UPPER BLACK DEM PROFILE |
| 10000.020 | DEM: Profile Startpoint | Point symbol | 10001: UPPER RED DEM PROFILE, 10004: YELLOW DEM PROFILE |
| 10000.021 | DEM: Profile Stopover | Point symbol | 10001: UPPER RED DEM PROFILE 10004: YELLOW DEM PROFILE |
| 10000.022 | DEM: Profile Endpoint | Point symbol | 10001: UPPER RED DEM PROFILE 10004: YELLOW DEM PROFILE |
| 10000.041 | DEM: Vertical Grid Line | Line symbol | 10006: LOWER BLACK DEM PROFILE |
| 10000.051 | DEM: Profile Restaurant | Point symbol | 10000: UPPER BLACK DEM PROFILE 10001: UPPER RED DEM PROFILE 10007: UPPER WHITE DEM PROFILE |
In the Units and Formats category, you can choose, whether the distance is to be shown in km or in m. In addition, you can set the time format (at the moment only h:mm is available) and the rounding (no rounding, 5 minutes, 10 minutes). Uncheck the Show text at the bottom of the profile option if you do not want any text under the profile.
In the Labels and Symbols category, labels and symbols can be allocated to the start- and endpoint or a stopover. Enter a label in the corresponding field (for example the name of a place) and choose a symbol from the dropdown list. These symbols are defined in the template file. Add a Corner Vertex to the line which defines the profile to create a stopover.
![]() Click into one of the columns on the left or right after typing a label text to make OCAD saving this entry.
Click into one of the columns on the left or right after typing a label text to make OCAD saving this entry.
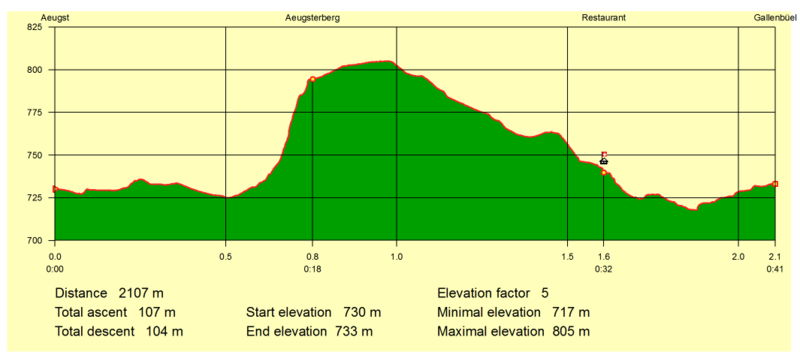
Click the OK button when finished. In the next dialog you have to save the profile at the desired location. To open the document, use the Open Recently Exported Documents function in the File menu. The profile can be edited (e.g. change colors or add objects) there.
Stopovers are marked with a dot on the profile line and a vertical line to the x-axis. At the start- and endpoints as well as the stopovers the covered distance and the walking time are indicated.
Export PNG 


Click the Export PNG button to export the profile as a raster image. The Save Picture dialog box appears. Browse a location and enter a name for the new file. Choose the file type in the Save as type drop down list. Click the Save button to finish. The exported profile looks the same as the profile shown in the DEM Profile dialog.
Add to map 

Note: This function is similar to the Export OCD function. For more information and illustrations visit the corresponding article.
Click the Add to map button to add the profile to the currently opened map. The DEM Profile Options dialog appears.
The Template DEM Profile.ocd file in the OCAD-directory is chosen as a template file (for the symbol set, colors etc.) by default. You can choose an own template by clicking the Load template button.
In the Units and Formats category, you can choose, wheter the distance is to be shown in km or in m. In addition, you can set the time format (at the moment only h:mm is available) and the rounding (no rounding, 5 minutes, 10 minutes). Uncheck the Show text at the bottom of the profile option if you do not want any text under the profile.
In the Labels and Symbols category, labels and symbols can be allocated to the start- and endpoint or a stopover. Enter a label in the corresponding field (for example the name of a place) and choose a symbol from the dropdown list. These symbols are defined in the template file. Add a Corner Vertex to the line which defines the profile to create a stopover.
Click the OK button when finished. The symbols and colors from the template file are added to the current symbol set and the profile is displayed.
Click the Print button to print the profile. The profile is printed exactly as it is diplayed in the dialog box.
Back to the DEM page.


