DEM Import Wizard
With the DEM Import Wizard you can import DEM data and create different outputs like Contour lines, a Hill shading map or a Vegetation height map. The main purpose of the DEM Wizard is to create base maps for orienteering map making.
![]() There is a tutorial which shows a possible way to proceed and use LiDAR data in OCAD for orienteering sport.
There is a tutorial which shows a possible way to proceed and use LiDAR data in OCAD for orienteering sport.
DEM Import Data 


The DEM Import Wizard is able to import files with regular and irregular DEM data. Supported DEM data formats are:
las, laz and zLas Files
The LAS format (*.las) is a file format designed for the interchange and archiving of lidar point cloud data.
The *.laz and *.zLas files are compressed LAS file.
OCAD uses the laszip.exe and LASliberator tools form Martin Isenburg to decompress the laz and zLas files.
ASCII Grid XYZ file and Raw data ASCII XYZ file
File format *.xyz
ESRI ASCII Grid
File format *.asc
SRTM Files
This is a world wide available DEM data set from the Shuttle Radar Topography Mission (SRTM). SRTM data (*.hgt) import requires that a coordinate system set in the OCAD map file.
Link: https://lta.cr.usgs.gov/SRTM1Arc
rar Files
Please note that OCAD can not handle file names with Non-ASCII character like Å.
File format *.rar
GML file
File Format *.gml or *.xml
TIFF file
File Format *.tif
Please not that normally a *.tif file is a raster image that is used as background map. However, some *.tif files can store DEM data and can therfore be imported and processed in the DEM Import Wizard.
Start Import DEM Wizard
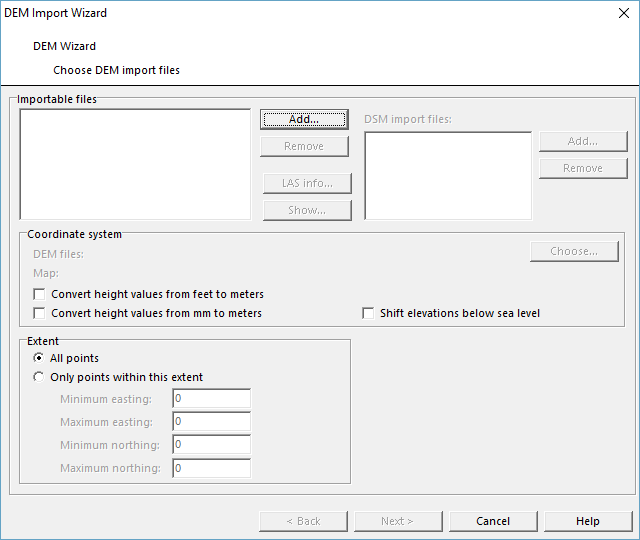
Open the DEM Import Wizard in the DEM Menu. The DEM Import Wizard appears. Otherwise you can also drag and drop an DEM file from Windows File Explorer onto the OCAD drawing area.
Importable Files
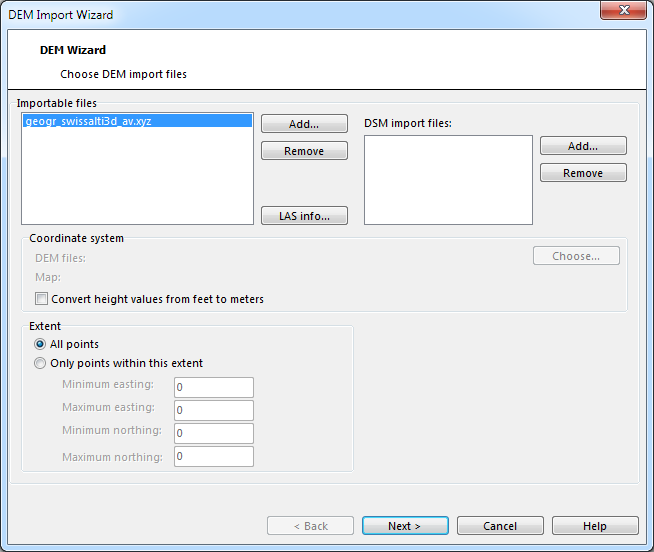
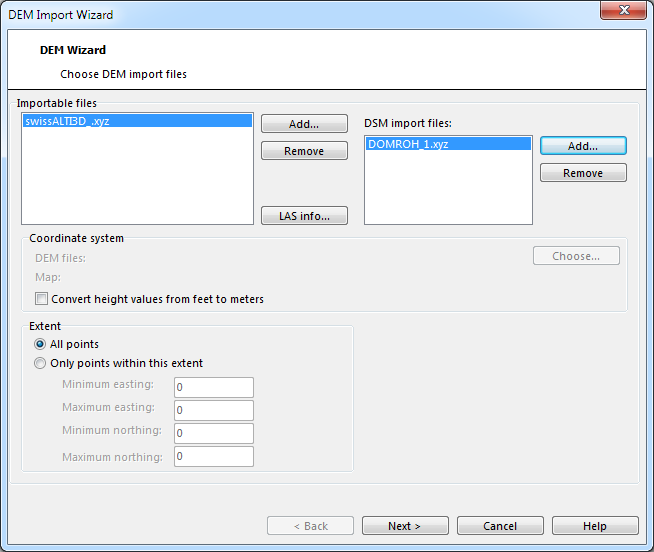
First use Add button to add at least 1 DEM to the DEM Import Wizard dialog.
Alternatively, just drag&drop the files into the drawing area
You have three different options:
- Choose a las files which often contain both DTM and DSM data
- Choose only DTM data
- Choose DTM and DSM data
Choose las Files
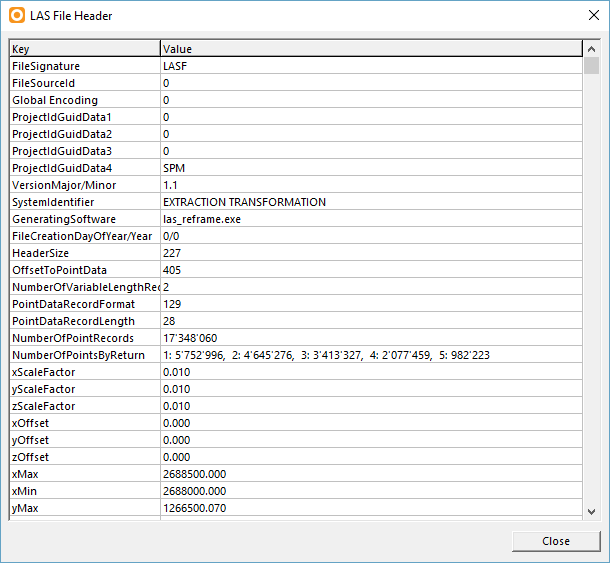
- After adding a las file you can select the item and click the LAS Info button. The LAS File Header dialog opens wich shows the information from the file header like the Number of Points by Return or the Extent.
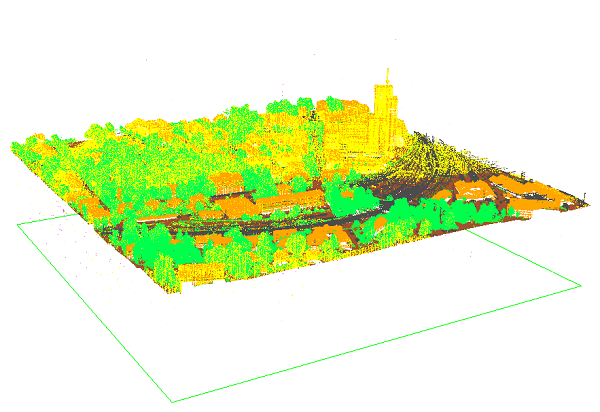
- Click on Show to see the tile in LasView.
Choose DTM Data
Add only the DTM file(s).
Please note that not all functions (e.g. vegetation height) are available if only DTM data are available.
Choose DTM and DSM Data
Add the DTM file(s) on the left side and the DSM file(s) on the right.
If the DSM have an other extent than the DTM then OCAD cuts to the DSM to the extent of the DTM or the choosen extent.
Coordinate System
Usually the DEM data are in the same coordinate system as the OCAD map. So no transformation is necessary.
OCAD supports the transformation during the DEM import. Click the Choose button to select the coordinate system of the DEM data.
In this example OCAD transforms the DEM data from US State Plane (Feet) to the metric UTM Zone 18 North.
- Convert height values from Feet to Meters: Optional it is possible to convert also the height values from Feet to Meters. Some DEM data in USA are provides in Feet.
- Convert height values from mm to Meters: Optional it is possible to convert also the height values from Millimeters (mm) to Meters. Some DEM data in UK are provides in mm.
- Shift elevations below sea level: OCAD cannot work with elevations below the sea level. OCAD shifts them to 0m when importing the data. This option is a temporary workaround. If the option is checked then OCAD shifts all elevations by 1000m. So check this option if you have terrain below the sea level.
Extent
DEM data are often big. So the calculation needs a lot of time and memory. If you do not need the whole extent of DEM data you can enter here the used extent.
![]() The extent is in terms of the Map Coordinate System, not the Input Coordinate System.
The extent is in terms of the Map Coordinate System, not the Input Coordinate System.
Please note that when an object is selected in the drawing area and you open the DEM Import Wizard, OCAD uses the extent of the selected object as default extent.
Click the Next button. OCAD imports the file(s). Depends on the file size of data this step can takes some minutes. The Settings dialog appears.
Settings
This dialog shows the information about the DEM data.
Analyze Files
OCAD shows here the information about the map extent and the average number of point per square meter.
If the source file is a regular grid (data type of import files = grid), the Cell size box is set to read only. OCAD sets the same cell size for the imported DEM. For irregular DEM data source (data type of import files = raw) the cell size can be set in the 'cell size' box. For these DEM's OCAD interpolates a regular grid with the specified cell size during the import. The cell size depends on the import data and the further usage of the DEM.
![]() The Cell size range is between 0.01 and 650 m. A resolution of 1 m is appropriate for orienteering base maps.
The Cell size range is between 0.01 and 650 m. A resolution of 1 m is appropriate for orienteering base maps.
File Name
During the import procedure the imported DEM must be saved in the OCAD DEM file format (*.ocdDem) and it is loaded to the OCAD map.
Choose here the file name of this DEM file.
If only one import file is choosen OCAD uses by default the file name of the import file. Otherwise the filename of the ocd map.
If the ocd file is untiteled OCAD exports the DEM files in the temporary user directory (C:\Users\XXX\AppData\Roaming\OCAD\OCAD 20xx\Tmp).
Options
OCAD can create different outputs depending on the choosen import data type (DTM and DSM or only DTM).
- Create Contour Lines
- Create Hypsometric Map
- Create Hill Shading
- Calculate Slope Gradient
- Classify Vegetation Height
- Extract features
- Create Raw Data Points Map
- Create ocdLas File for LiDAR Point Cloud Manager
- Create vegegetation base map
Check or uncheck these outputs. OCAD shows for each output a page with options later in the DEM Import Wizard.
LAS Settings
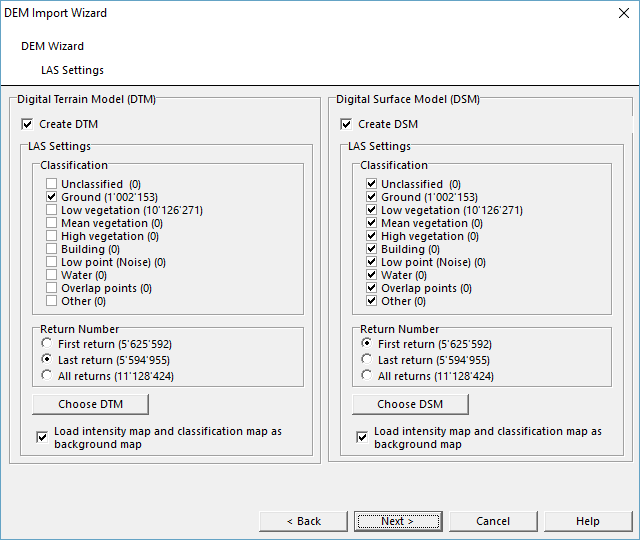
The LAS Settings dialog is only visble when importing las/laz/zlas files.
On the left side OCAD shows the information about the DTM, on the right to the DSM. If is possible to create both DEMs in one step or only one DEM.
Each point is classified. The value in the round brackets is the number of points for this classification.
- Click the Choose DTM button to reset the Classification ans Return Number option to the default values.
- Click the Choose DSM button to reset the Classification ans Return Number option to the default values.
Usually the default setting are right. But in some cases it makes sense to uncheck the overlap point for the DSM. It depends on the used data. Change also this settings if the data are not classified.
Create Intensity and Classification Map
Check the option Create intensity and classification map to create these maps. If created OCAD loads these raster maps as background maps.
Intensity Map
Each data point has an intensity of the returned laser beam. This intensity is shown in a grayscale map.
Example:
Classification Map
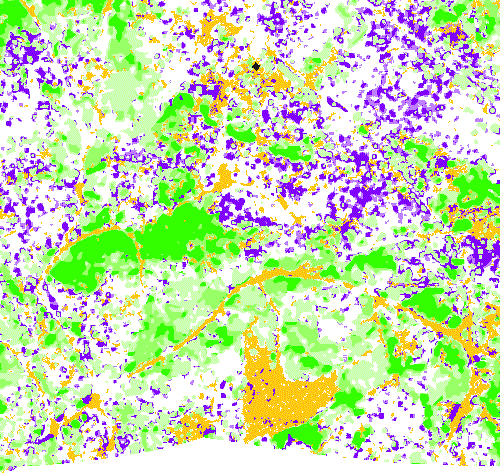
Each data point has a classification or is unclassified. This classification is shown in a colored map.
Example:
The classification tiff image has the following color index:
- 0 Created, never classified (light gray)
- 1 unclassified (red)
- 2 Ground (yellow)
- 3 Low Vegetation (light green)
- 4 Medium Vegetation (green)
- 5 High Vegetation (dark green)
- 6 Building (Generic) (gray)
- 7 Low point (noise) (gray)
- 9 Water (blue)
- 10 Bridge (brown)
- 11 Road (brown)
- 12 Overlap pointd (gray)
Create Contour Lines 


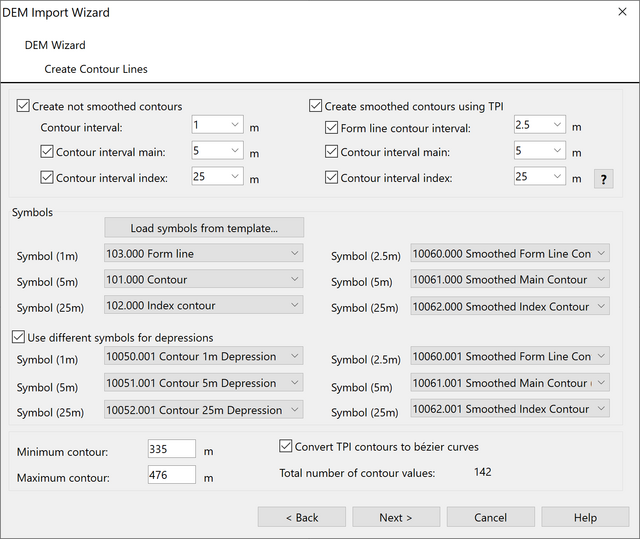
Choose Create Contour Lines from DEM menu or from DEM Import Wizard. The Create Contour Lines dialog box appears.
This function calculates contour lines based on the DEM.
- Choose between Custom contours and Smoothed contours.
Create custom contours (no smoothing): Creates custom contour lines as you are used from older OCAD versions. There will be no smoothing. Use these contours for your fieldwork. You will see every terrain detail on it, provided you chose contour interval small enough. An contour intervall of 1m, based on a 1m grid, is good practice for orienteering maps.
Create smoothed contours using TPI: TPI stands for Topographic Position Index, which is defined as the difference between a central pixel and the mean of its surrounding cells. Choosing this option, OCAD first creates a smoothed DEM using TPI and calculates contours afterwards in combination with 3D-smoothing. Some details may get lost, but results are very satisfying, especially in constant slopes. Use these contours, if you want to adopt the calculated contour lines directly to your map.
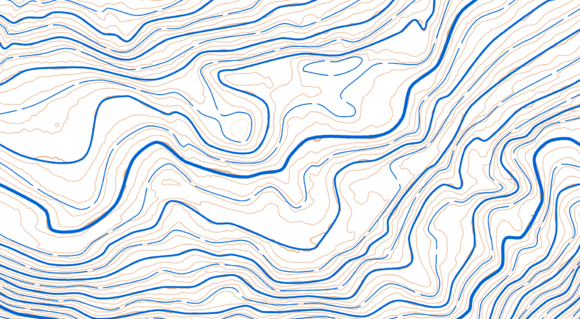
Custom contour lines in brown, smoothed contour lines using TPI in blue.
- Define 1-3 contour intervals (for example 1m, 5m, 25m) for custom and/or smoothed contour lines.
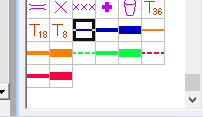
- Choose a line symbol for each type appears. By default, the first three line symbols in the settings are pre-selected. Load symbols from template to get 12 line symbols at the bottom of your symbol box, which you can use for the settings.
- Choose Use different symbols for depression to distinguish depressions from hills.
- Choose Convert TPI contours to bézier curves to convert the contours from polylines to bézier curves.
- Specify the minimum (lowest) and maximum (highest) contour for the calculation.
Create Hypsometric Map
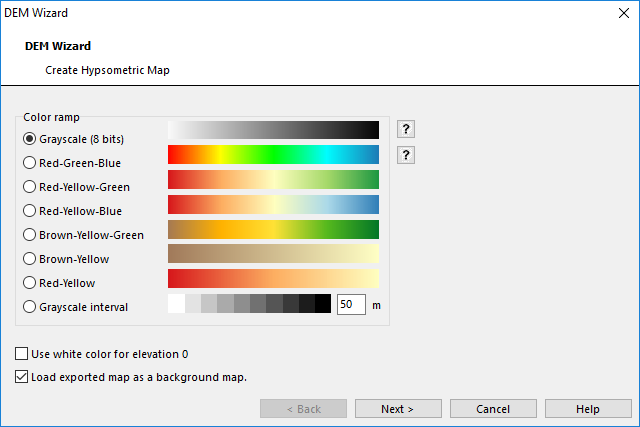
Choose Create Hypsometric Map from DEM menu or from DEM Import Wizard. The Create Hypsometric Map dialog box appears.
The progression is from highest at left to lowest at right.
This function calculates a grayscale or colored hypsometric map as GeoTIFF file. Choose one of the color ramps.
Optionally you can set white color for areas with no data.
Optionally the created raster file is directly loaded as background map.
Create Hill Shading
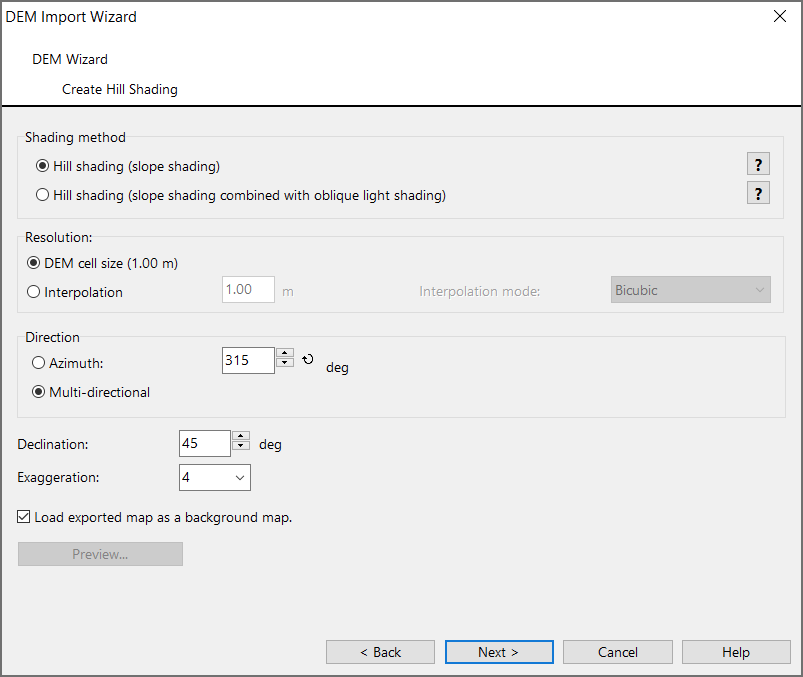
Choose Create Hill Shading from DEM menu or from DEM Import Wizard. The Create Hill Shading dialog box appears.
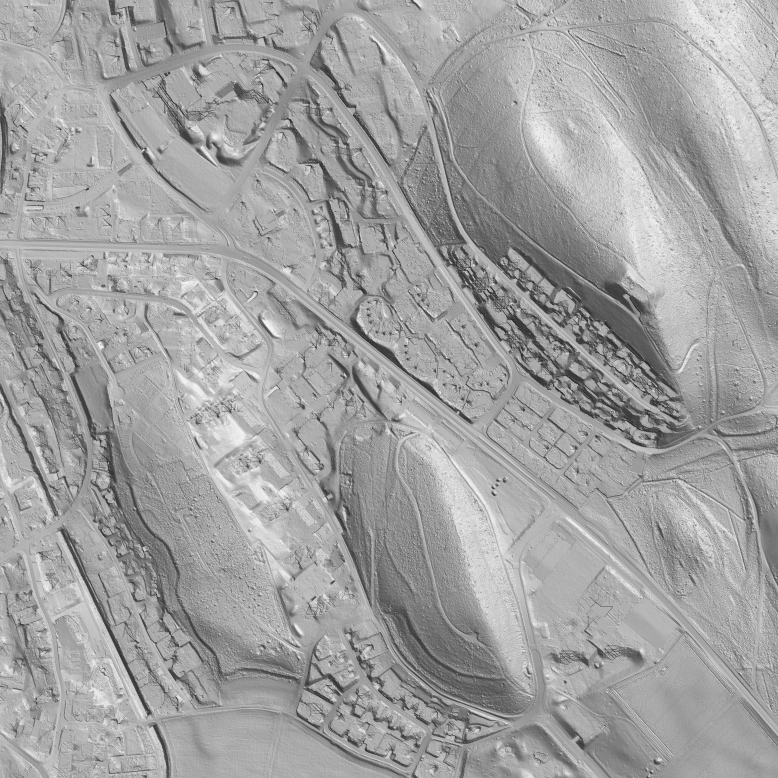
This function calculates a shaded relief picture (hill shading).
Shading method
There are two calculation methods available:
- Slope shading is optimized to see outlines of features like paths in a slope.
- Slope shading combined with oblique light shading is the recommended method if the hill shading should be used as a background relief of a map.
Optionally the calculated hill shading is directly loaded as background map.
Resolution
Aside from the chosen method, there is to define the Resolution and the Interpolation mode if chosen. The default interpolation mode is Bicubic, but there are 7 other algorithm.
Direction
Azimuth: The direction of the light source is 315° (north-west).
Multi-directional: This is a merged image from 4 different images, in which the light source comes from one cardinal direction each. This is the default setting.
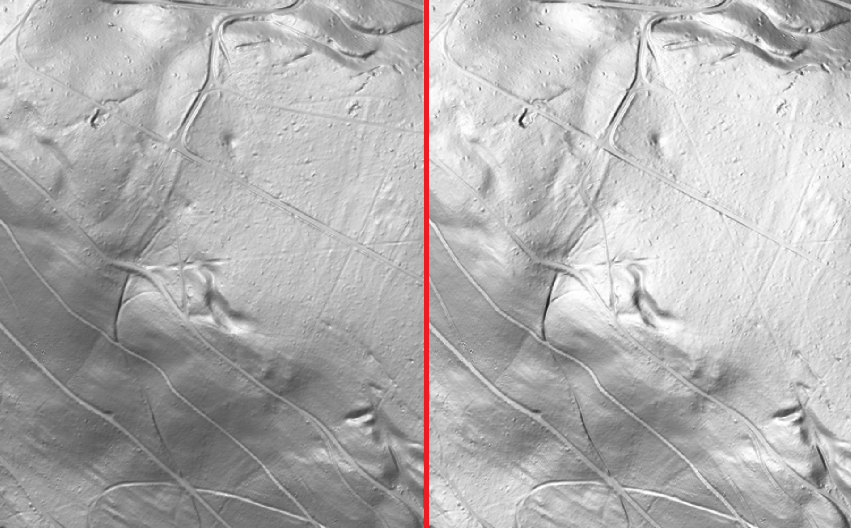
Left picture: Azimuth 315° | Right Picture: Multi-directional
Declination means the elevation of the light source Default setting is 45°.
An Exaggeration factor of 4 is pre-selected and can be altered.
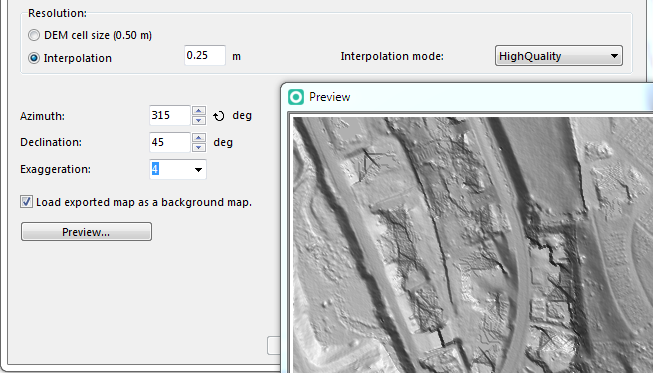
Preview
The Preview... button allows you get a first impression of the current setting for your hillshading and can be use to optimize it. Click and move with the left mouse button allows to pan the current view.
The Preview... button is only enabeld when importing a dem grid file or an ocddem is already loaded. This function is disabled when importing las/laz files.
![]() To detect point and line objects like paths or watercourses from DEM we recommend using the same resolution as the DEM. To create a relief and if the DEM cell size isn’t high then we recommend to set a smaller resolution.
To detect point and line objects like paths or watercourses from DEM we recommend using the same resolution as the DEM. To create a relief and if the DEM cell size isn’t high then we recommend to set a smaller resolution.
![]() The default export file format is JPEG and creates an 8 bit JPEG with in grayscale and a world file with the geo reference. If you decide to export the file in TIFF-format, only with resolution option ‘DEM cell size’ then OCAD creates an 8 bit grayscale tiff with color palette. Otherwise a 24 bit RGB tiff.
The default export file format is JPEG and creates an 8 bit JPEG with in grayscale and a world file with the geo reference. If you decide to export the file in TIFF-format, only with resolution option ‘DEM cell size’ then OCAD creates an 8 bit grayscale tiff with color palette. Otherwise a 24 bit RGB tiff.
Hillshiding (slope shading)
Hillshiding (slope shading combined with oblique light shading)
Error Message Bitmap is too big
The size of the hill shading image is limited. If this error message appears please enter a bigger value for the interpolation.
Calculate Slope Gradient
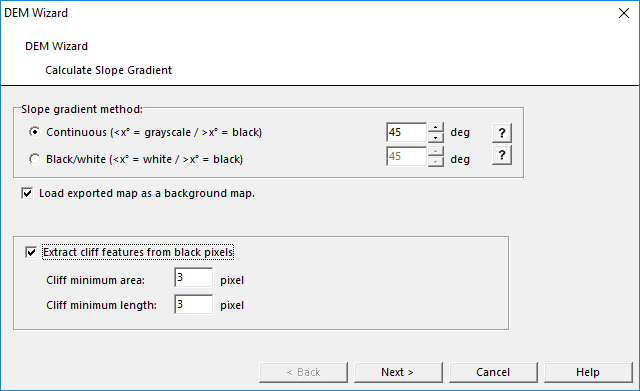
Choose Calculate Slope Gradient from DEM menu or from DEM Import Wizard. The Calculate Slope Gradient dialog box appears.
Slope Gradient Method
Select one of two different methods:
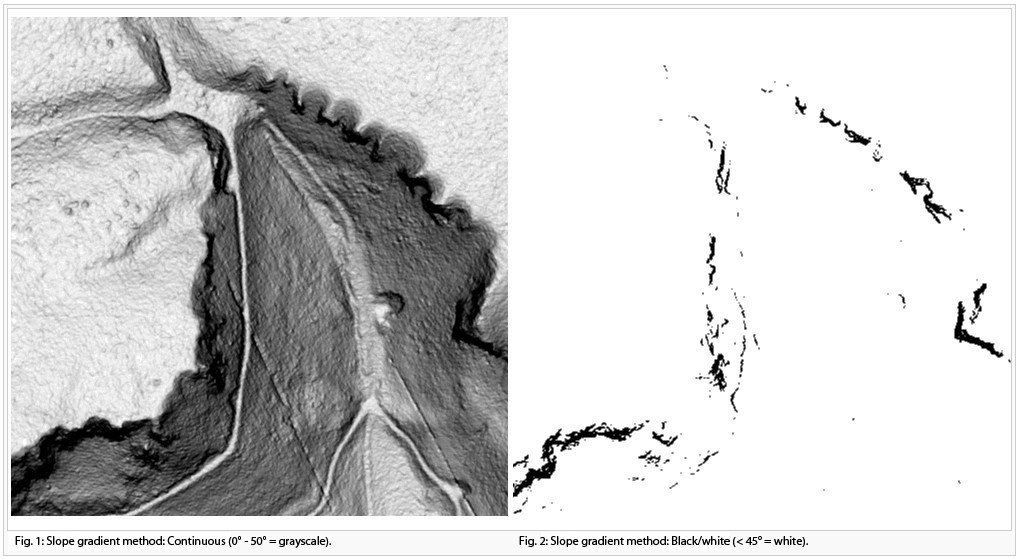
- Continous (<x° = grayscale / >x° = black)
- Black/White (<x° = white / >x° = black)
Enter the slope gradient threshold. Slope gradinet values over this threshold will be displayed with black pixels.
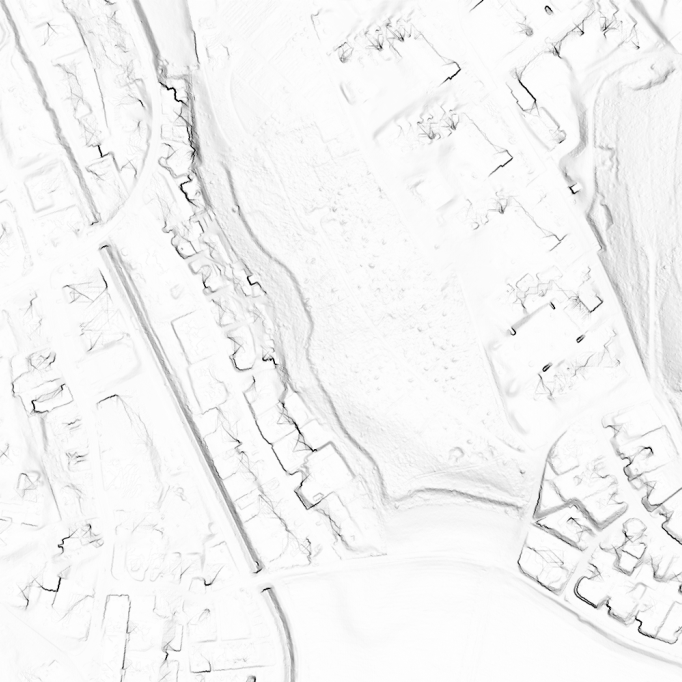
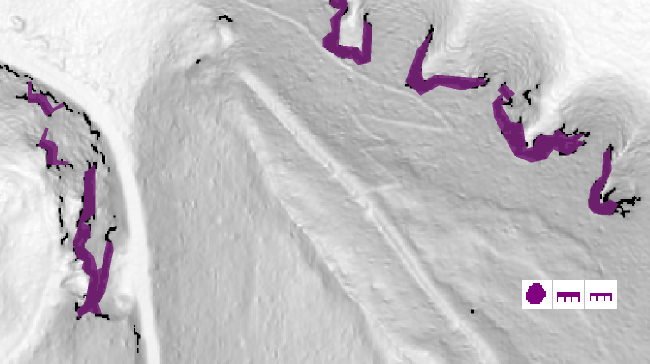
The resulting picture can be used to identify cliffs an rock faces. The result can sometimes be significantly improved with a slight adjustment of the gradient threshold (between 42-45 degrees).
Slope gradient also shows paths or relief features independent from a azimut like the Hill Shading.
Extract Cliff Features From Black Pixels
Choose this option to automatically convert cliffs into vector symbols. OCAD vectorizes the black pixels from the slope gradient calculation. By adjusting the gradient threshold, you can influence the number of cliffs.
You can also adjust the Cliff minimum area and the Cliff minimum length in pixel. The higher this value is, the more distinctiv your cliffs need to be before OCAD vectorizes them.
Three symbols will be added automatically to your Symbol Box when choosing this option: One area symbol for bigger cliffs and two line symbols for smaller cliffs. Select the cliffs and change their Symbol if desired.
Classify Vegetation Height
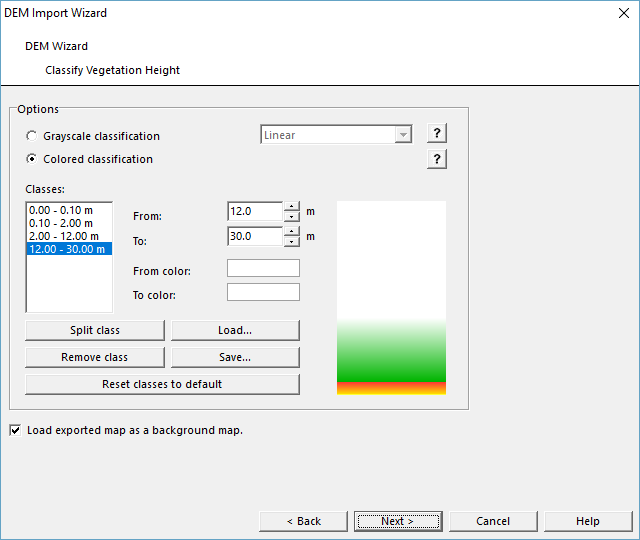
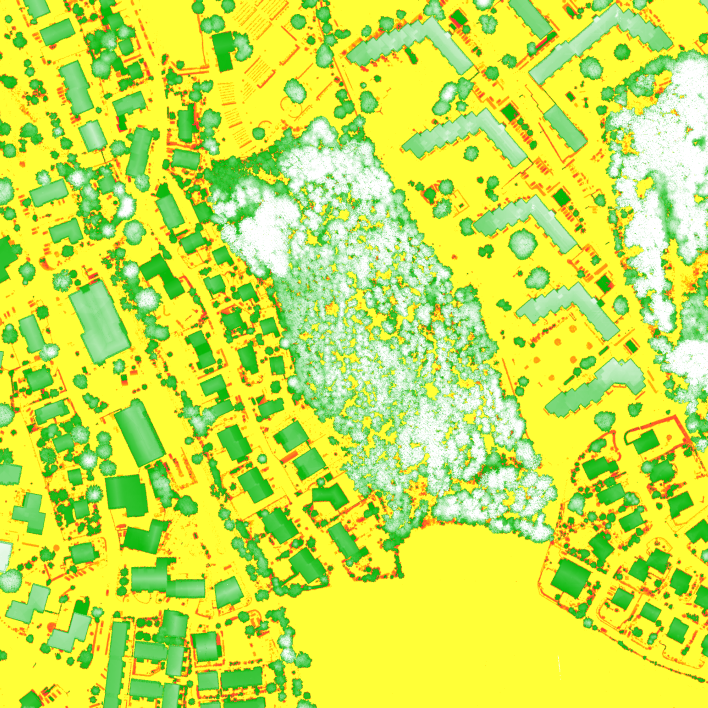
Choose Classify Vegetation Height from DEM menu or from DEM Import Wizard. The Classify Vegetation Height dialog box appears.
There are two different options to show vegetation height classification:
- Gray scale classification with options: Linear, Quadratic negative, Quadratic positive
- Colored classification: Define classes with a height and color range
- - Split a class into two classes by clicking the Split class button
- - Remove a class by clicking the Remove class button
- - Load the settings from a text file by clicking the Load button
 Several templates with different color profiles can be loaded in OCAD for the calculation of the vegetation height map.
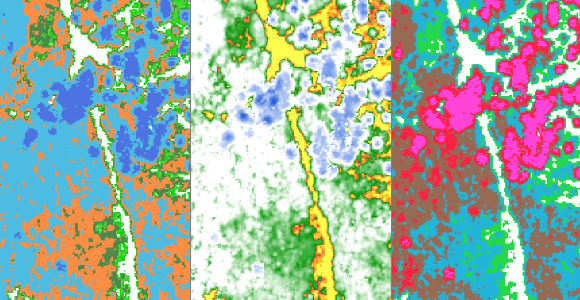
- - Save the settings to a text file by clicking the Save button
- - Reset the classes and colors to the default settings by clicking the Reset classes to default button
Extract Features
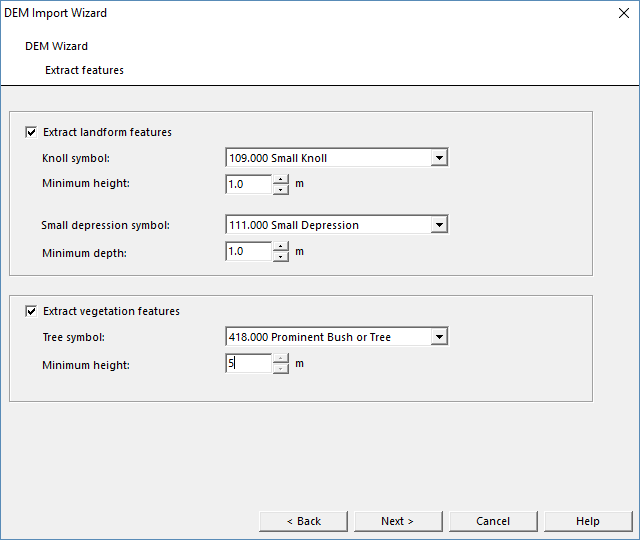
Choose Extract features from DEM Import Wizard. The Extract features dialog box appears.
This function extracts automatically landform and vegetation features from your data. The function is computationally intensive and may take a while.
- Extract landform features: Choose this option to extract landform features. Define symbols for knoll and small depression.
- Extract vegetation features: Choose this option to extract vegetation features. Define the tree symbol.
For both landform and vegetation features, you can adjust the Minimum height.
The chosen symbols will be loaded directly to your map.
Note: This function is (1) very dependend on the quality of the data and (2) the results should be treated with caution. In terms of LiDAR data, a small knoll looks very similar to a cluster of branches, a tree stump or a small fir tree. However, the results can give you a hint, which places you should check carefully during fieldwork.
Create Raw Data Points Map
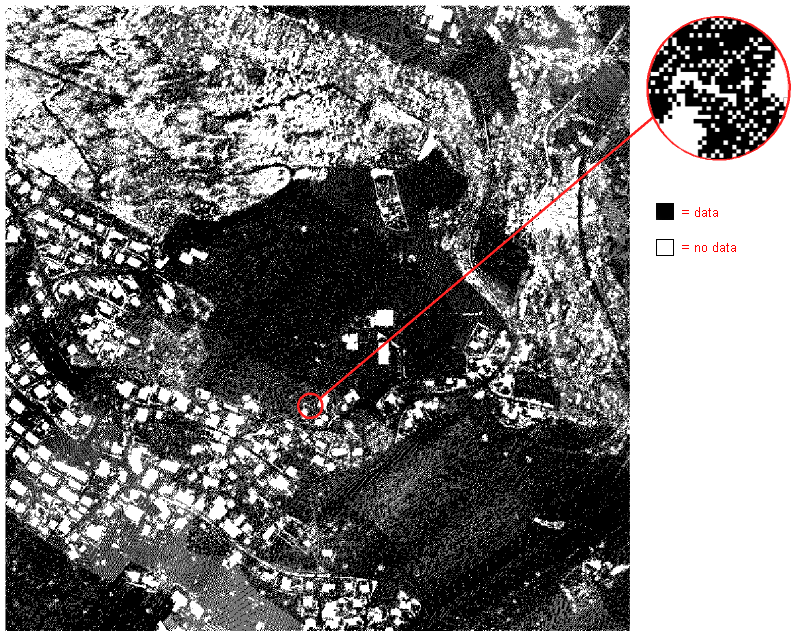
The Raw Data Points Map shows you where there are data and not.
There is no further dialogue for this option.
Create ocdLas File for LiDAR Point Cloud Manager
There is no further dialogue for this option.
The output is an ocdLas file, which contains all poitns of the LiDAR point cloud and it is optimized for the use with OCAD.
This file is used to analyze the vegetation. This file is often very big (> 1 GB).
Learn more about the ocdLas file functions on the LiDAR Point Cloud Manager page.
Create Vegetation Base Map
If you checked this option in the DEM Settings, a Vegetation Base Map will be calculated with default values.
To adjust the settings, you need to run the LiDAR Point Cloud Manager.
Summary
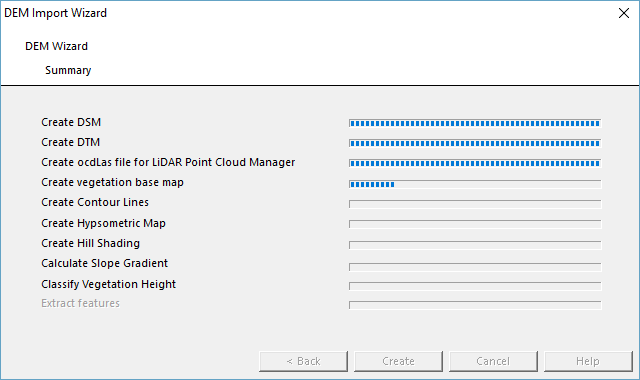
This dialog is only visible in DEM Import Wizard. It shows the progress of the different functions.
After finishing the process the dialog closes automatically.
