To use the OCAD Route Analyzer 2.0, course setters need a current map as well as a Digital Elevation Model (DEM).
This is loaded into the map or course setting file and ensures that the climbing and slope gradient are included in the route calculation. The DEM is typically created by the cartographer and has traditionally required a lot of memory.
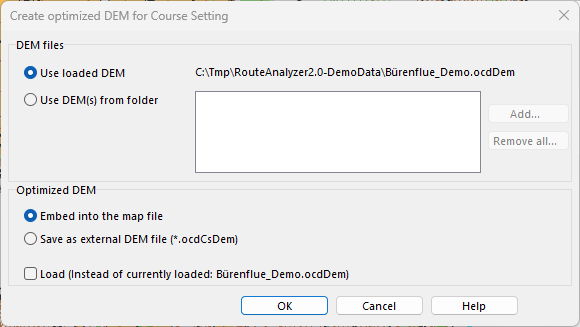
The DEM can now be optimized and compressed without loss of quality for route calculation. This significantly reduces the file size of the DEM and makes it easier to share. The optimized elevation model can also be embedded directly into the map or course setting file, as is already possible with layout images.
On mobile devices, you can zoom in and out at will. Zooming in is appreciated by the map makers as it allows more precise drawing and sketching and more accurate display of the background map.
However, by zooming in and out, map makers are not working at a fixed scale and so the sense of distance within the map is lost. This was easier when mapping with pen and paper where the scale was fixed.
A few things can be done to improve the feeling for the scale on a mobile device:
Working with the OCAD Sketch App
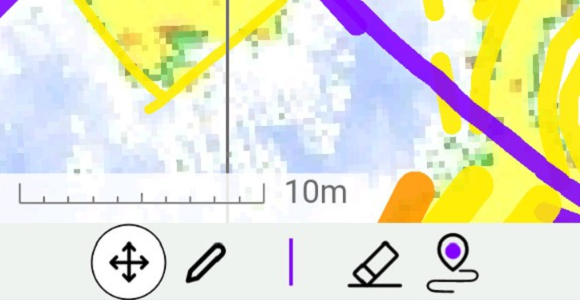
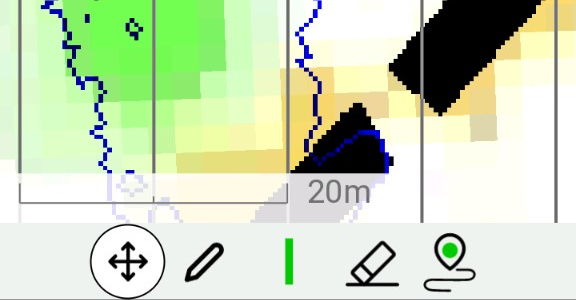
Make use of the scale bar that has been added in the latest update of the app. The scale bar can be turned on or off in the settings.
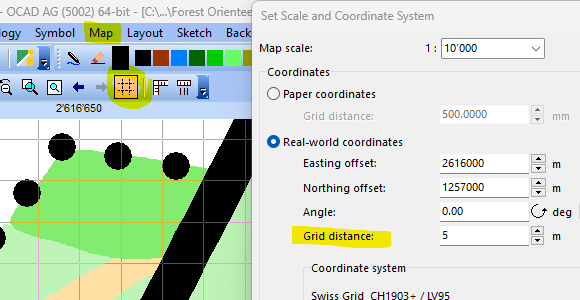
Adjust the distance between the north lines. You can do so in the settings. E.g., set it to 1mm in a project with a 1:10’000. This gives you every 10 meters a line. In a 1:4’000 project, use 2.5mm to get a line every 10 meters.
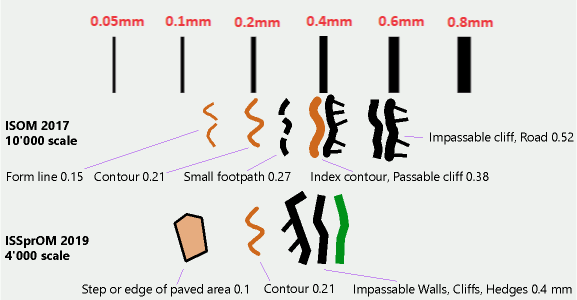
Know the different line widths. It is advantageous to know the line widths and to sketch objects accordingly. E.g., an impassable wall on a sprint map with a line width of 0.4mm and contour lines with a line width of 0.21mm.
In OCAD Desktop, it is also possible to check directly during drawing whether the drawn line or area object corresponds to the minimum dimension of the IOF, as we explain in this blog post.
The OCAD Route Analyzer 2.0 has been released as a beta version.
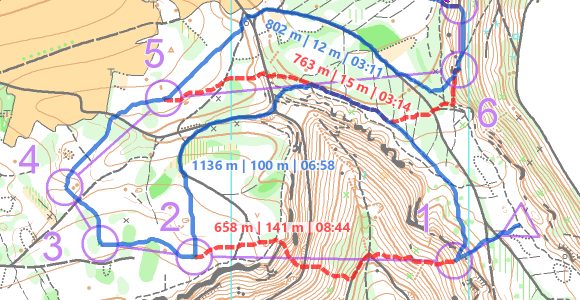
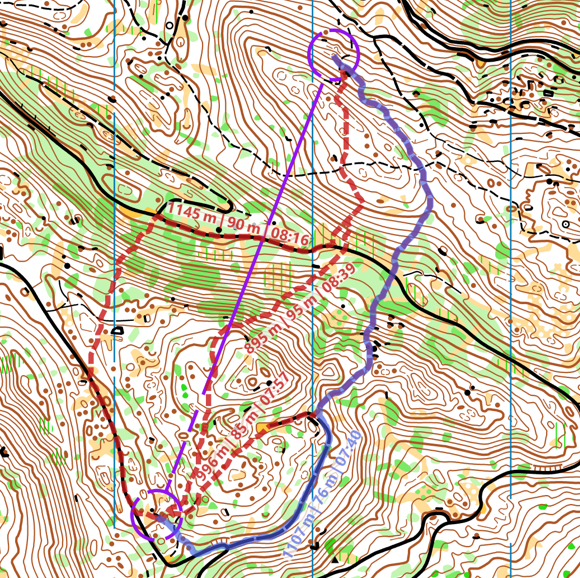
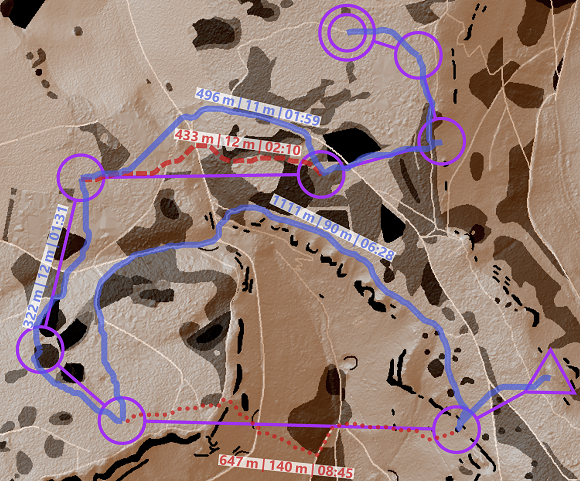
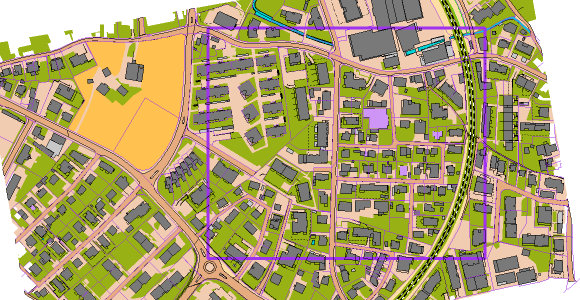
Thanks to the consideration of runnability and relief, the Route Analyzer 2.0 can find the fastest routes between two controls in urban as well as in classic forest terrain.
The fastest calculated routes (blue) and alternatives (red).
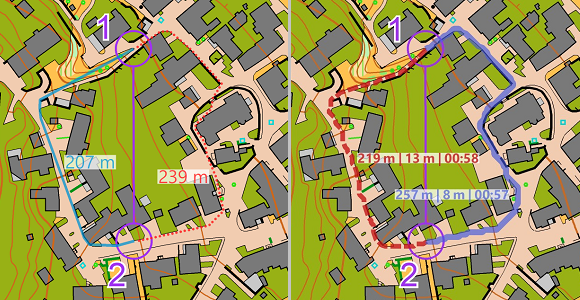
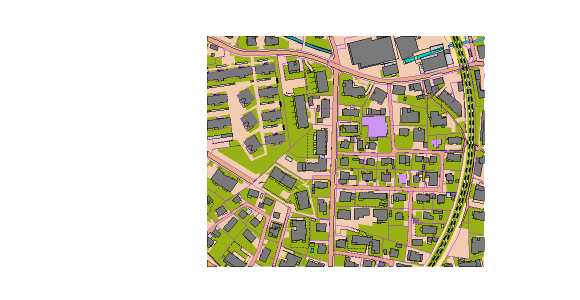
The previous version of the Route Analyzer is limited to 2D sprint maps, because it assumes a constant speed and only distinguishes between passable and impassable map objects. The shortest route is displayed as the result.
Comparison between the old and the new version of the Route Analyzer. The left route option is shorter, but has more meters to climb than the right option.
Consideration of runnability and relief
To find the fastest route, the Route Analyzer takes into account the distance, the relief and the runnability.
Therefore, resistance values are assigned to the individual map symbols. These are based on assumptions and can be changed in the settings. It is well known that the forest is not equally runnable depending on region and season.
The influence of the relief must be divided into two factors: The difference in altitude in the running direction and the slope transverse to the running direction. The latter causes a reduced speed when running along a steep slope.
In order to take the elevation into account, a DEM has to be loaded. For runnability, each OCAD symbol is assigned a resistance value, which can be adjusted manually.
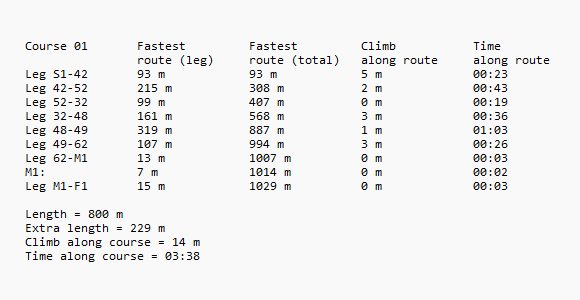
Taking these influencing factors into account, the algorithm calculates the fastest route from one control to the next. Alternative routes can be added with via points, which are mandatory to pass. In OCAD, the distance, climbing and expected running time are displayed for each route.
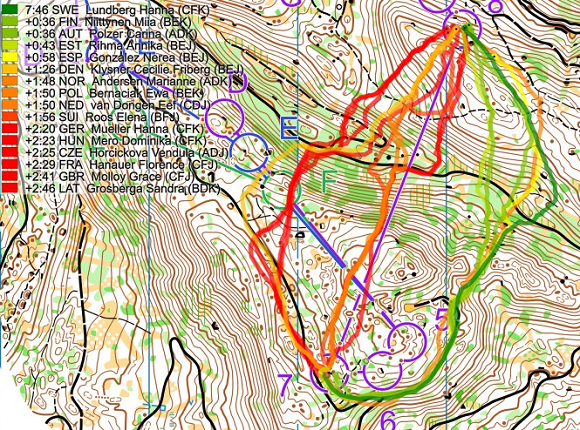
The fastest calculated routes (blue) and alternatives (red) in the WOC 2023 Women Relay.
Up-to-date map symbols and elevation model required
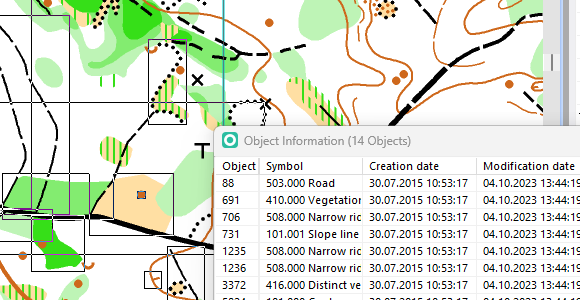
A prerequisite for correct functioning with the new calculation method is a map with a current set of symbols and a digital elevation model (DEM). When assigning the resistance values, OCAD accesses the map symbols. If their properties (symbol number, color values, line thickness, etc.) are within a range defined by OCAD, an assignment is made. An up-to-date symbol set that complies with the specifications of the International Orienteering Federation is therefore advantageous.
The DEM is normally created by the map maker to calculate e.g. contour lines or a hill shading map. Newly, the DEM can be more easily passed on to the course setters as an optimized and compressed Course Setting DEM (ocdCsDem) due to the greatly reduced file size, or even directly embedded into the map file or course setting file.
Resistance Layer and hill shading map.
Many application possibilities
Thanks to the relative time difference between route variants, the Route Analyzer 2.0 can be used as an aid for planning exciting route choices in all orienteering disciplines. In addition, it can be used to calculate distance, amount of climbing and expected running time along the ideal route of an entire orienteering course at the push of a button. Besides, the Route Analyzer 2.0 can also point out undesirable or dangerous routes, e.g. due to missing restricted areas or unclearly drawn maps.
Whether the displayed route is actually the fastest route depends on individual factors such as personal strengths, in addition to those already mentioned such as region and time of year. With the help of GPS routes, the fastest route can be determined in retrospect or at least guessed. Nevertheless, it is exciting to compare the personally favored routes with the calculated results.
Route comparison by Jan Kocbach (World of O) WOC 2023 Women Relay.
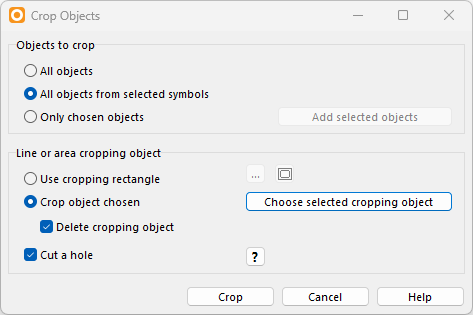
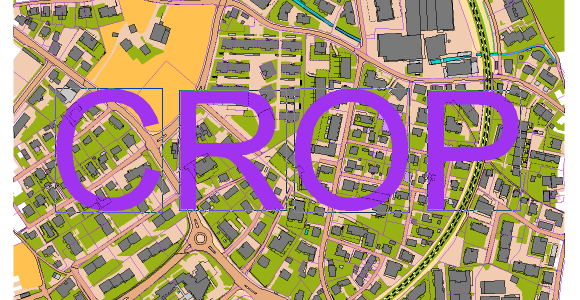
A map should be cropped to the extent of the purple line object. You can also use a cropping rectangle instead of selecting a crop object, see Settings below.Map has been cropped to the extent of the chosen crop object.Settings
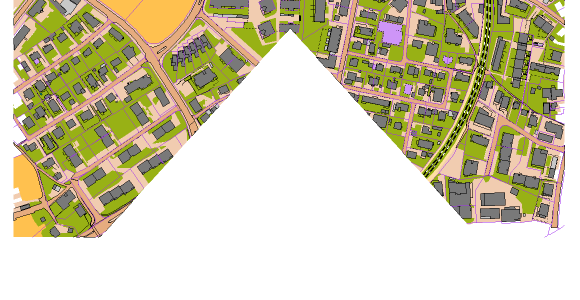
Create a hole Use this method to cut away parts of the map.
A map where the part of the purple line object is to be cut away. Cropped mapSettings. Note that Cut a hole is activated.
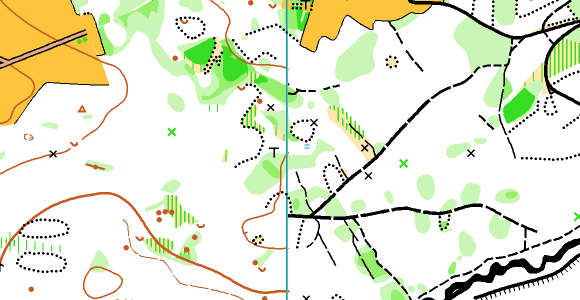
In the left part, all smaller paths and roads were cut. In the right part all terrain objects like contour lines, knolls or depressions.
Special: Crop Text You can also use text objects as cropping objects. Just convert them first into Graphic Objects in the Object menu.
Choose a text symbol and add a text.Select the text object, go to menu Object>Convert into Graphic Object.Select each graphic object and use it to cut a hole into the map.